Category Archives: Visual Studio

Query Tags in EF Core for ASP .NET Core 3.1 Web Apps

By Shahed C on April 27, 2020

This is the seventeenth of a new series of posts on ASP .NET Core 3.1 for 2020. In this series, we’ll cover 26 topics over a span of 26 weeks from January through June 2020, titled ASP .NET Core A-Z! To differentiate from the 2019 series, the 2020 series will mostly focus on a growing single codebase (NetLearner!) instead of new unrelated code snippets week.

Previous post:

NetLearner on GitHub:

In this Article:

Q is for Query Tags in EF Core

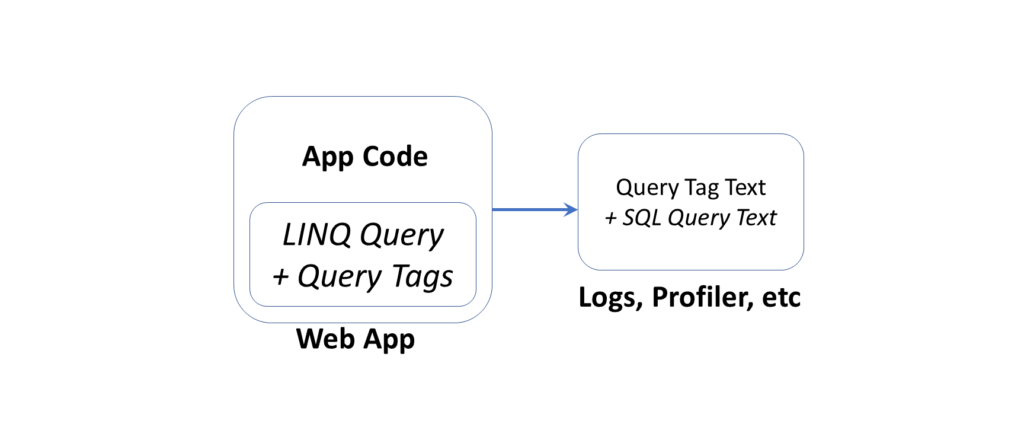
Query Tags were introduced in Entity Framework (EF) Core 2.2, as a way to associate your LINQ Queries with SQL Queries. This can be useful when browsing log files during debugging and troubleshooting. This article explains how Query Tags work, how to find the output and how to format the text strings before displaying them.
Query Tags in ASP .NET Core web apps

NOTE: You may have read that Query Types have been renamed to entities without keys, but please note that Query Types (introduced in EF Core 2.1) are not the same thing as Query Tags.

As of ASP .NET Core 3.0 Preview 1, EF Core must be installed separately via NuGet (e.g. v3.0.0-preview4.19216.3), as it is no longer included with the ASP .NET Core shared framework. Also, the dotnet ef tool has to be installed as a global/local tool, as it is no longer part of the .NET Core SDK. For more information, see the official announcement for Preview 4, where it was first mentioned:

Implementing Query Tags

The NetLearner source code includes a C# model called LearningResource, with a few basic fields:

public class LearningResource
{
    public int Id { get; set; }

    [DisplayName("Resource")]
    public string Name { get; set; }


    [DisplayName("URL")]
    [DataType(DataType.Url)]
    public string Url { get; set; }

    public int ResourceListId { get; set; }
    [DisplayName("In List")]
    public ResourceList ResourceList { get; set; }

    [DisplayName("Feed Url")]
    public string ContentFeedUrl { get; set; }

    public List<LearningResourceTopicTag> LearningResourceTopicTags { get; set; }
}

A collection of LearningResource objects are defined as a DbSet in the LibDbContext database context class:

public DbSet<LearningResource> LearningResources { get; set; }

The GetTop() service method in the LearningResourceService class defines a Query Tag with the TagWith() method, as shown below:

public async Task<List<LearningResource>> GetTop(int topX)
{
    var myItems =
    (from m in _context.LearningResources
        .Include(r => r.ResourceList)
        .TagWith($"This retrieves top {topX} Items!")
        orderby m.Id ascending
        select m)
    .Take(topX);

    return (await myItems.ToListAsync());
}

In the above query, the TagWith() method takes a single string value that can they be stored along with wherever the resultant SQL Queries are logged. This may include your persistent SQL Server database logs or Profiler logs that can be observed in real-time. It doesn’t affect what gets displayed in your browser.

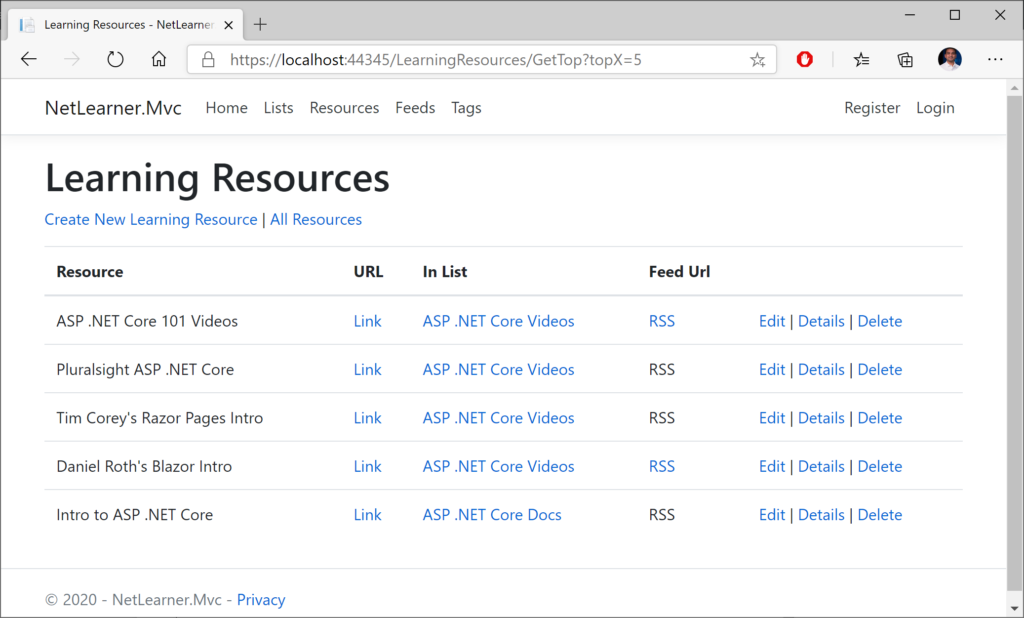
This can be triggered by visiting the LearningResourcesController’s GetTop method, while passing in an integer value for topX. This causes the Index view to return the top “X” learning resources in a list. For example: if topX is set to 5, the resulting view will display 5 items in the displayed list.
Observing Query Tags in Logs

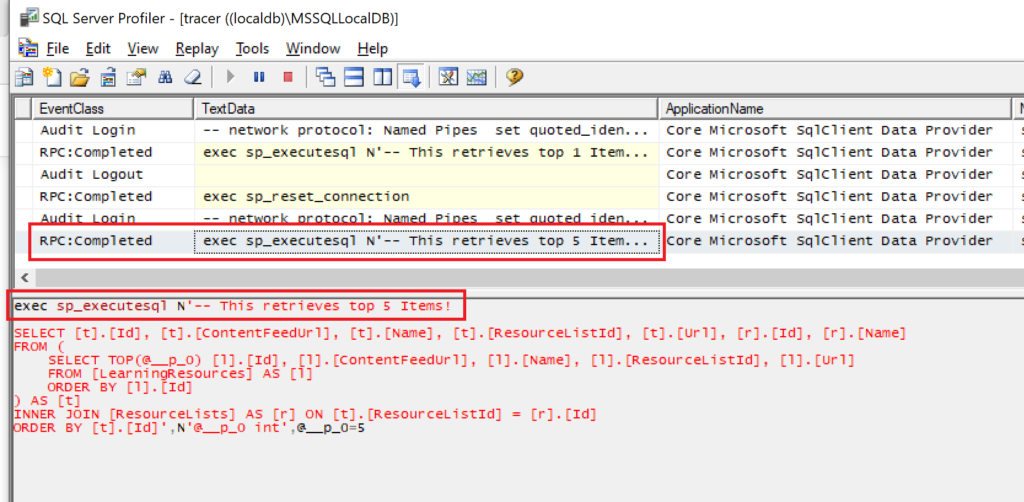
Using the SQL Server Profiler tool, the screenshot below shows how the Query Tag string defined in the code is outputted along with the SQL Query. Since topX is set to 5 in this example, the final string includes the value of topX inline within the logged text (more on formatting later).
SQL Server Profiler showing text from Query Tag

From the code documentation, the TagWith() method “adds a tag to the collection of tags associated with an EF LINQ query. Tags are query annotations that can provide contextual tracing information at different points in the query pipeline.

Wait a minute… does it say “collection of tags”…? Yes, you can add a collection of tags! You can call the method multiple times within the same query. In your code, you could call a string of methods to trigger cumulative calls to TagWith(), which results in multiple tags being stored in the logs.

Formatting Query Tag Strings

You may have noticed that I used the $ (dollar sign) symbol in my Query Tag samples to include variables inline within the string. In case you’re not familiar with this language feature, the string interpolation feature was introduced in C# 6.

$"This retrieves top {topX} Items!"

You may also have  noticed that the profiler is showing the first comment in the same line as the leading text “exec sp_executesql” in the Profiler screenshot. If you want to add some better formatting (e.g. newline characters), you can use the so-called verbatim identifier, which is essentially the @ symbol ahead of the string.

@"This string has more
than 1 line!"

While this is commonly used in C# to allow newlines and unescaped characters (e.g. backslashes in file paths), some people may not be aware that you can use it in Query Tags for formatting. This operator allows you to add multiple newlines in the Query Tag’s string value. You can combine both operators together as well.

@$"This string has more than 1 line 
and includes the {topX} items!"

In an actual example, a newline produces the following results:
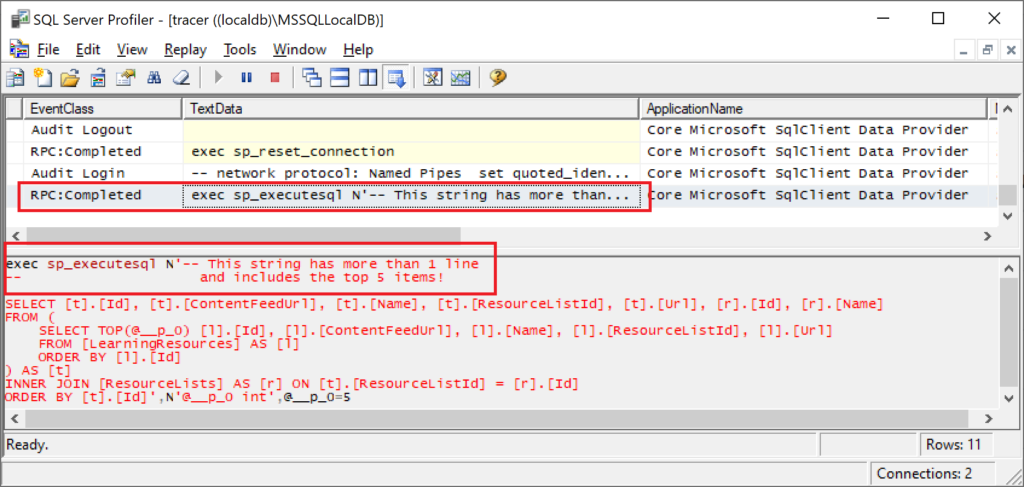
SQL Server Profiler, showing Query Tag text with newline

The above screenshot now shows multiline text from a Query Tag using newlines within the text string.

References

Production Tips for ASP .NET Core 3.1 Web Apps

By Shahed C on April 20, 2020

This is the sixteenth of a new series of posts on ASP .NET Core 3.1 for 2020. In this series, we’ll cover 26 topics over a span of 26 weeks from January through June 2020, titled ASP .NET Core A-Z! To differentiate from the 2019 series, the 2020 series will mostly focus on a growing single codebase (NetLearner!) instead of new unrelated code snippets week.

Previous post:

NetLearner on GitHub:

In this Article:

P is for Production Tips

After getting through more than halfway in this A-Z series, this blog post takes a step back from application code to focus on productions tips. Once you’re ready to deploy (and maintain) your web app in production, there are many tips and tricks you should be aware of. In fact, feel free to discuss with your team members and the dev community to learn about other ways developers are deploying in production.

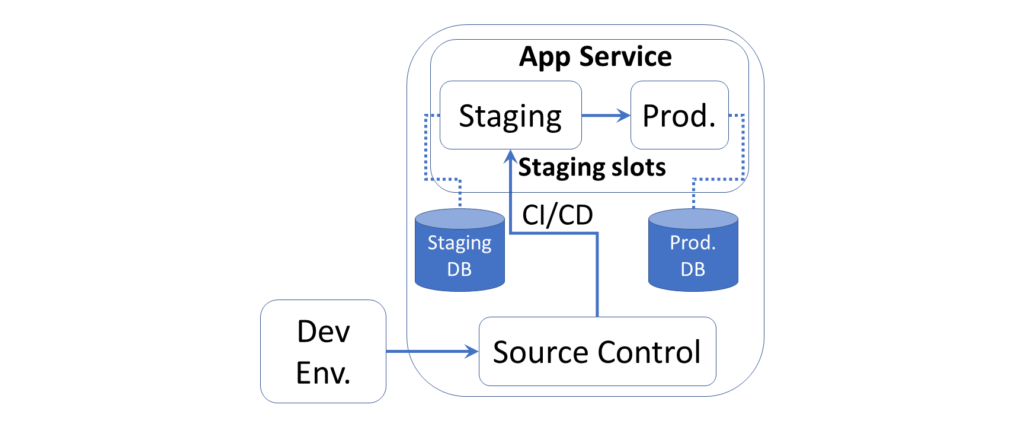
Server Environments from Dev to Prod via Staging

While this article focuses on deployments to Azure App Service, you can use some of the lessons learned for your own environments. That being said, I would highly recommend taking a look at Azure for all your staging and production deployment needs.

Deployment Slots

Azure makes it very easy to deploy your ASP .NET Core web application with the use of Deployment Slots. Instead of publish a web app directly to production or worrying about downtime, you can publish to a Staging Slot and the perform a “swap” operation to essentially promote your Staging environment into Production.

NOTE: To enable multiple deployment slots in Azure, you must be using an App Service in a Standard, Premium, or Isolated tier.

If you need help creating a Web App in App Service, you may refer to my blog post on the topic:

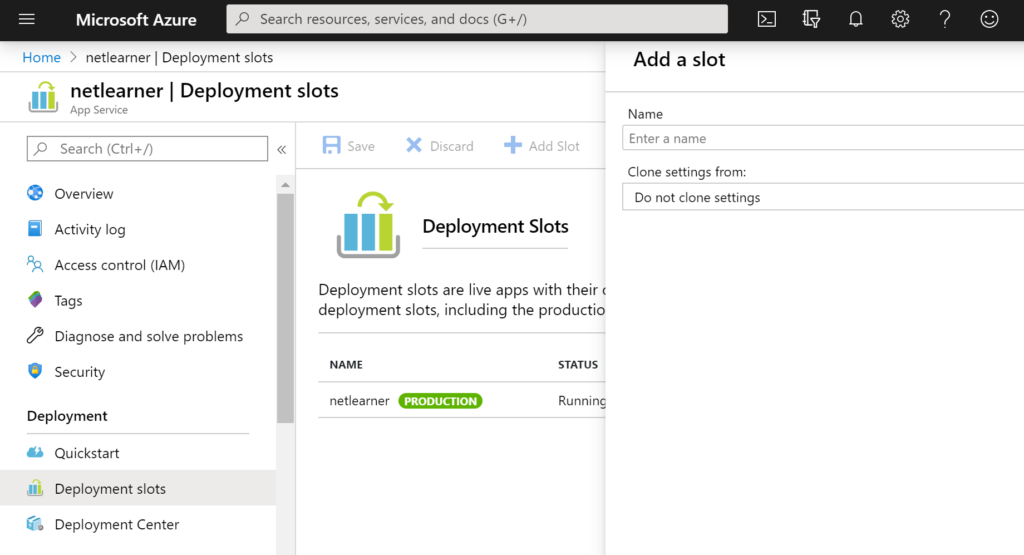
To make use of deployment slots for your Web App:

  1. Log in to the Azure Portal.
  2. Create a new Web App if you haven’t done so already.
  3. Locate the App Service blade for your Web App
  4. Enter the Deployment Slots item under Deployment
  5. Click + Add Slot to add a new slot
  6. Enter a Name, chose a source to clone settings (or not)
  7. Click the Add button to create a new slot
Deployment Slots in Azure App Service

Once you set up multiple slots for staging and production, you may use the Swap feature to swap your deployed application when the staged deployment is ready to be deployed into production. Note that all slots are immediately live at the specified endpoints, e.g. hostname.azurewebsite.net.

You may also adjust website traffic by setting the Traffic % manually. From the above screenshot, you can see that the Traffic % is initially set to 0 for the newly-created slot. This forces all customer traffic to go to the Production slot by default.

When deploying your application through various means (Visual Studio Publish, Azure CLI, CI/CD from your Source Control System, etc), you may choose the exact slot when there is more than one. You may also set up “Auto-Swap” to swap a slot (e.g. staging) automatically into production, upon pushing code into that slot.

To learn more about all of the above, check out the official docs at:

Environment Configuration

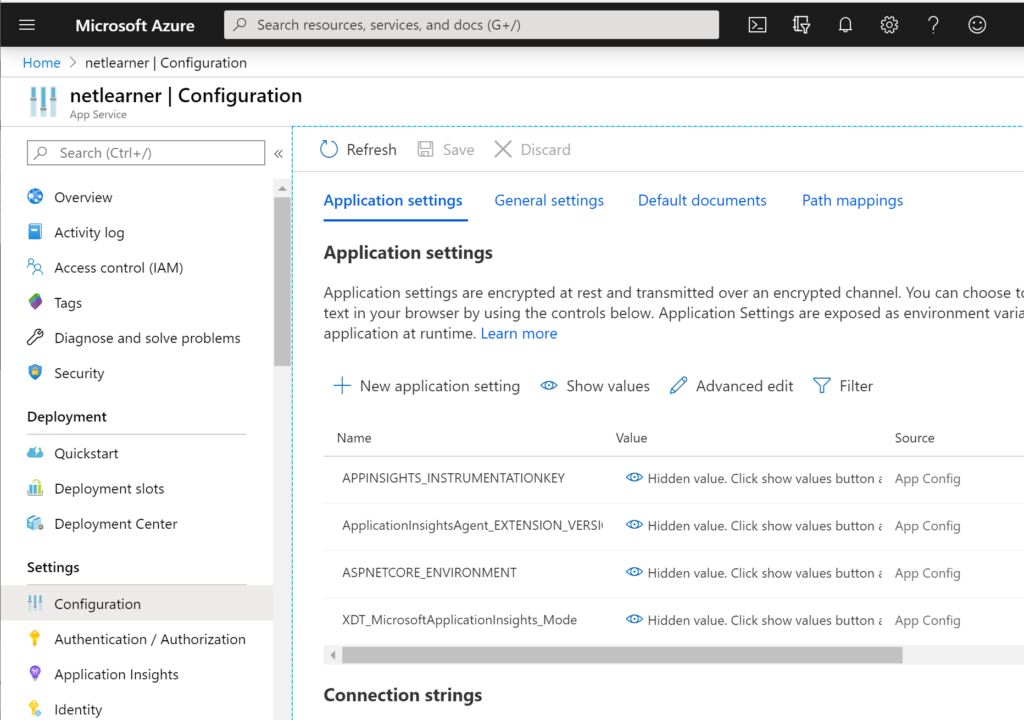
To maintain unique configuration settings for each environment (e.g. staging database vs production database connection strings), you should have unique configuration settings for each environment. This is easily accomplished using the Configuration section in the Settings category of each slot’s unique blade.

Configuration screen in Azure App Service

NOTE: If you need help with User Secrets for your development environment or Key Vault secrets for your server environment, consider the following posts from my 2018 series and earlier in this 2020 series:

EF Core Migrations

You may be wondering how you can deploy structural changes from your database into production. Perhaps, you write manual SQL scripts to run in production, maybe you use a tool to generate such SQL scripts or a combination of both. Many developers aren’t aware but you can actually make use of Entity Framework Core (EF Core) Migrations to update your database structure.

To get a quick refresher on EF Core Migrations and Relationships, check out the following post:

You wouldn’t typically run your “Update Database” command in production. Instead, you could generate a SQL Script from your EF Core Migrations. This will allow you to inspect the SQL Scripts (revise them if necessary), hand them over to a DBA if appropriate and finally run the SQL Scripts in production when required.

The following PowerShell command can be run in Visual Studio’s Package Manager Console panel:

Script-Migration

The following CLI Command can be run on a Command Prompt, PowerShell prompt or VS Code Terminal window:

dotnet ef migrations script

You may set specific migrations to start from and/or end on:

Script-Migration -To <starting-migration>
Script-Migration -From <ending-migration>

You may also dump out the SQL scripts into a file for further inspection:

Script-Migration -Output "myMigrations.sql"

Scalability

If you’re deploying your web apps to Azure App Service, it’s a no-brainer to take advantage of scalability features. You could ask Azure to scale your app in various ways:

  • Scale Up: Upgrade to a more powerful (and higher priced) tier to add more CPU, memory and disk space. As you’ve seen with the appearance of staging slots, upgrading to a higher tier also provides additional features. Other features include custom domains (as opposed to just subdomains under azurewebsites.net) and custom certificates.
  • Scale Out: Upgrade the number of VM instances that power your web app. Depending on your pricing tier, you can “scale out” your web app to dozens of instances.
  • Autoscaling: When scaling out, you can choose when to scale out automatically:
    • Based on a Metric: CPU %, Memory %, Disk Queue Length, Http Queue Length, Data In and Data Out.
    • Up to a specific Instance Count: set a numeric value for the number of instances, set minmium and maximum.

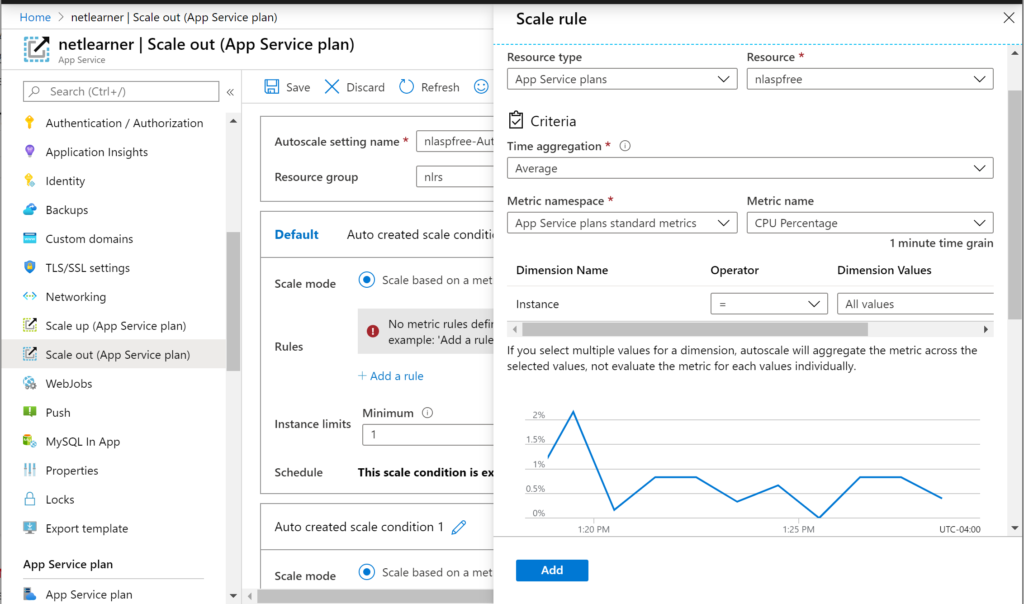
An example of autoscaling on a metric could be: “When the CPU% is >50%, increase instance count by 1“. When you had new scaling conditions, you may also set a schedule to start/end on specific dates and also repeated on specific days of the week.

Adding a Scale Rule to Scale Out in Azure App Service

NOTE: In order to make use of Auto-Scaling, you’ll have to upgrade to the appropriate tier to do so. You can still use Manual Scaling at a lower tier. Scalability features are not available on the F1 Free Tier.

CI/CD

There are countless possibilities to make use of CI/CD (Continuous Integration and Continuous Deployment) to make sure that your code has been merged properly, with unit tests passing and deployed into the appropriate server environments. Some of your options may include one of the following: Azure Pipelines, GitHub Actions, or some other 3rd party solution.

  • Azure Pipelines: an offering of Azure DevOps services, you can quickly set up CI/CD for your web app, both public and private.
  • GitHub Actions: available via GitHub, the relatively-new Actions feature allows you to automate your workflow

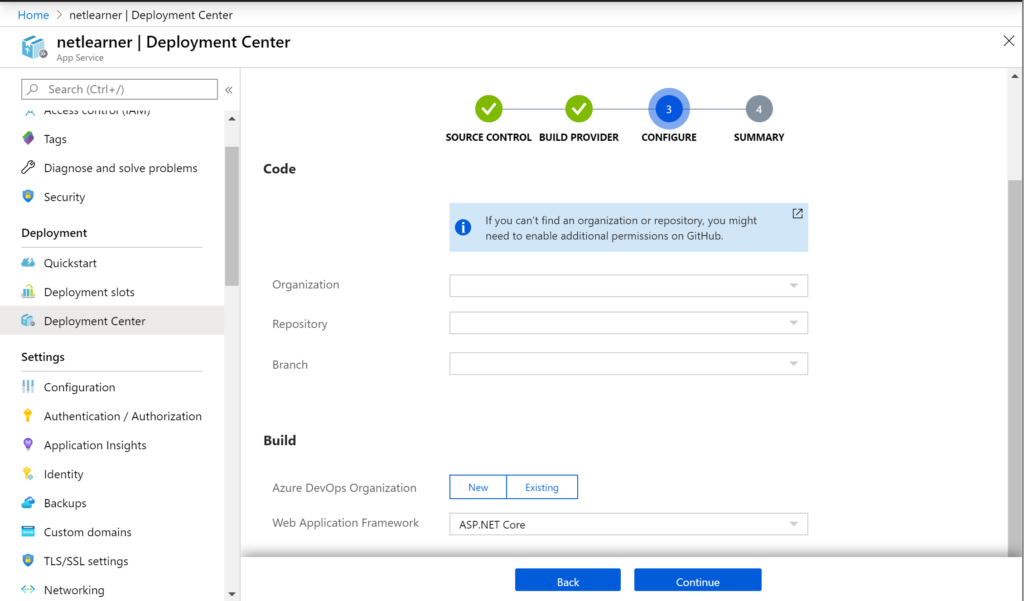
The Deployment Center feature in Azure’s App Service makes it very easy to select Azure Pipelines (under Azure Repos) for your web app. This is all part of Azure DevOps Services, formerly known as VSTS (Visual Studio Team Services)

Deployment Center in Azure App Service

To get started with the above options, check out the official docs at:

TeamCity and Octopus Deploy are also popular products in various developer communities. Whatever you end up using, make sure you and your team select the option that works best for you, to ensure that you have your CI/CD pipeline set up as early as possible.

Troubleshooting

Once your application has been deployed, you may need to troubleshoot issues that occur in Production. You can use a combination of techniques, including (but not limited to) Logging, Error Handling and Application Insights.

  • Logging: From ASP .NET Core’s built-in logging provider to customizable structured logging solutions (such as Serilog), logging helps you track down bugs in any environment.
  • Error Handling: Anticipating errors before they occur, and then logging errors in production help you
  • Application Insights: Enabled by default in Azure’s App Service, Application Insights literally give you insight into your web application running in a cloud environment.

For more information on Logging and Error Handling, check out the earlier posts in this series:

For more information on Application Insights, check out the official documentation at:

References

Organizational Accounts for ASP .NET Core 3.1

By Shahed C on April 13, 2020

This is the fifteenth of a new series of posts on ASP .NET Core 3.1 for 2020. In this series, we’ll cover 26 topics over a span of 26 weeks from January through June 2020, titled ASP .NET Core A-Z! To differentiate from the 2019 series, the 2020 series will mostly focus on a growing single codebase (NetLearner!) instead of new unrelated code snippets week.

Previous post:

NetLearner on GitHub:

NOTE: The NetLearner suite of apps won’t be updated to use organizational authentication in the main branch, so you can check out the new sample code in the experimental subfolder, merged from a branch:

In this Article:

O is for Organizational Accounts

If you’ve created new ASP .NET Core projects, you’ve probably seen an option to add authentication upon creation. In Visual Studio, the IDE provides radio buttons to select a specific type of Authentication. Using CLI commands (e.g. in the VS Code terminal) you can use the ‐‐auth flag to choose the type of authentication you’d like to add.

The possible values are:

  • None – No authentication (Default).
  • Individual – Individual authentication (accounts stored in-app).
  • IndividualB2C – Individual authentication with Azure AD B2C.
  • SingleOrg – Organizational authentication for a single tenant.
  • MultiOrg – Organizational authentication for multiple tenants.
  • Windows – Windows authentication..

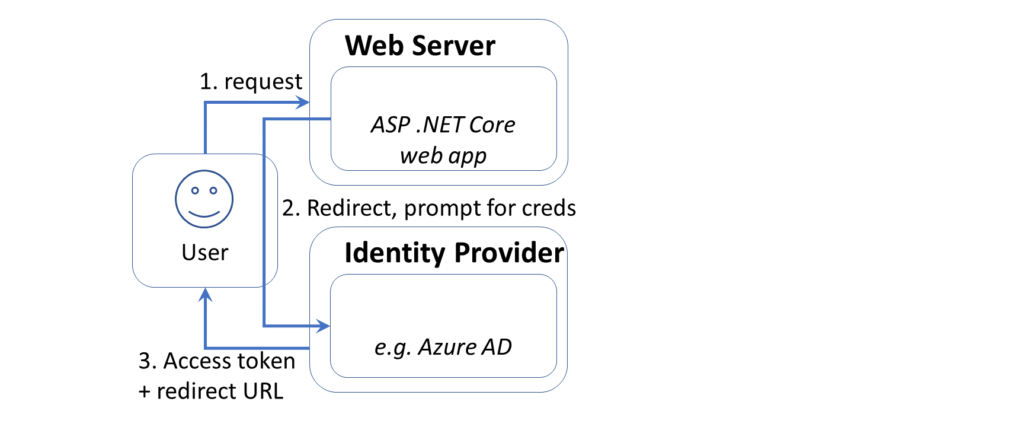
In this article, we will focus on the option for Work or School Accounts. This option can be used to authenticate users with AD (Active Directory, Azure AD or Office 365. This authentication process is illustrated in the diagram shown below:

ASP .NET Core web authentication via AzureAD

Adding Authentication

To add authentication to a new project quickly, here are the instructions for Visual Studio 2019.

If you choose to use the new splash screen:

  1. Click “Create a new project”
  2. Select “ASP .NET Core Web Application” or “Blazor” (server-side)
  3. Click Next
  4. Enter Project Name, Location, Solution Name
  5. Optional: check the checkbox to place in the same directory
  6. Click Create
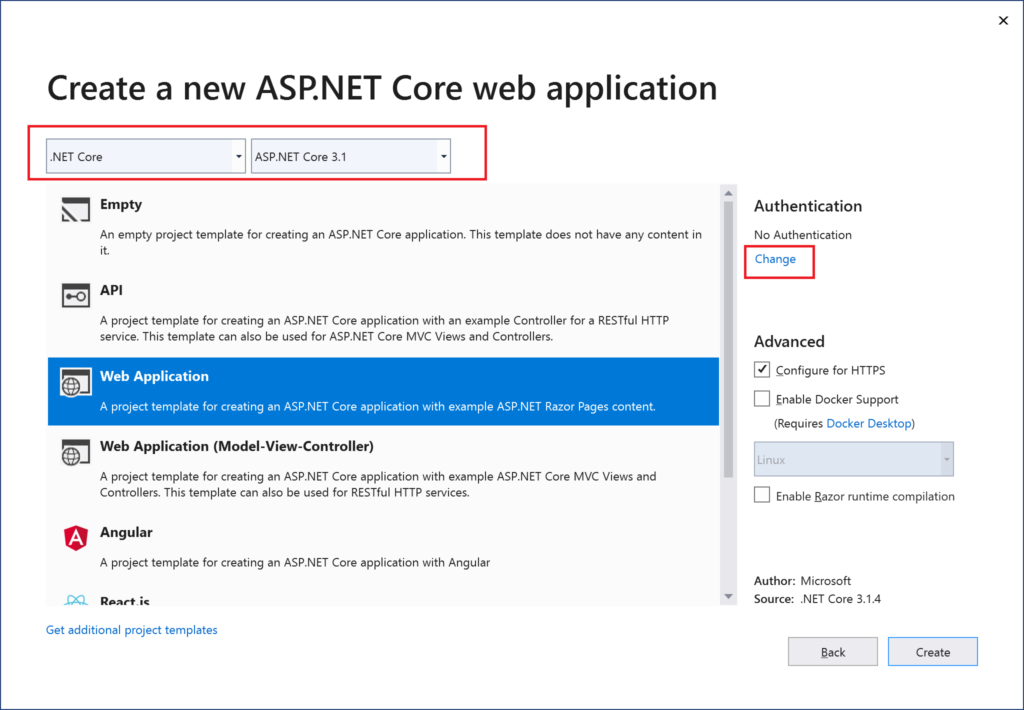
  7. Select .NET Core and then ASP .NET Core 3.1 from dropdowns
  8. Select a project type, e.g. Empty, Web Application (Razor Pages or MVC), Blazor App.
  9. Click the “Change” action link in the Authentication section
Creating a new web app project with authentication

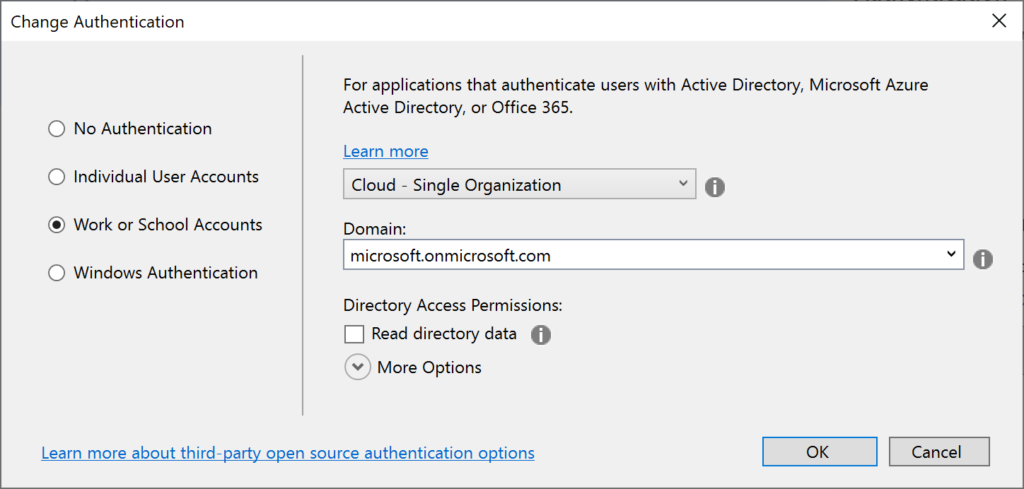
This should allow you to change the authentication type to “Work or School Accounts” so that you may your organizational domain info. As always, you may select the little info buttons (lowercase i) to learn more about each field. Talk to your system administrator if you need more help on what domains to use.

Work/School account selected for authentication method

NOTE: If you need help creating new .NET Core 3.1 project types in Visual Studio, take a look at this previous blog post in this series on .NET Core 3.0 to get some help on how to enable it.

If you wish to skip the Splash Screen instead upon launching VS2019:

  1. Click “Continue without code” in the lower right area of the splash screen.
  2. In the top menu, click File | New | Project (or Ctrl-Shift-N)
  3. Follow the remaining steps outlined earlier in this section

To use CLI Commands in a Terminal window, use the dotnet new command followed by the ‐‐auth flag. The authentication type can be any of the aforementioned authentication types, e.g. Individual.

dotnet new mvc --auth Individual -o myproj

Configuring App Registration

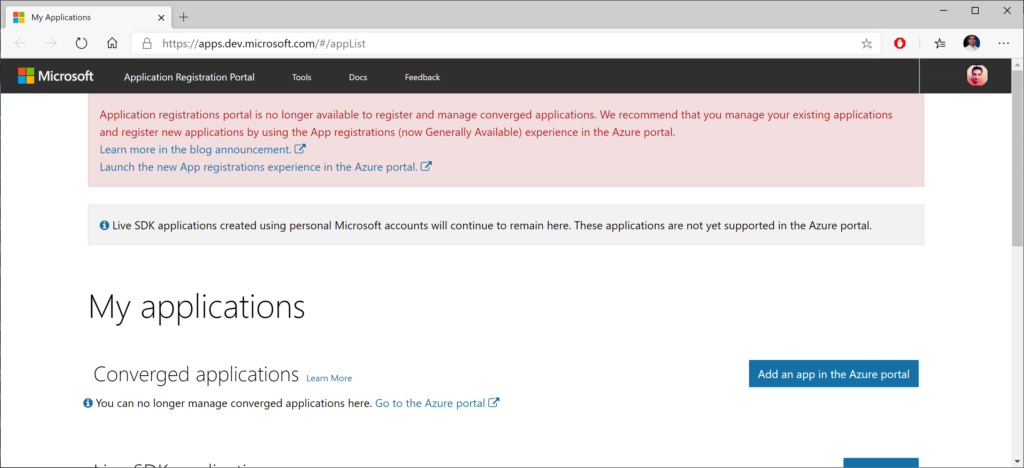
If you’ve used “Individual User Accounts” before, you’ve probably used a database to store user data, either on-premises or in the cloud. If you’ve used “Work or School Accounts” (i.e. organizational accounts), you may have the old App portal at the following URL:

Old App Registration Portal

On the old site, you may see a message suggesting that you should go to the Azure Portal to use the newer (current) App Registrations feature. This feature was previously in preview, and you can currently use it directly in the Azure Portal. If you click the link from the old site, it should take you directly to the App Registrations page, and may prompt you to log in first.

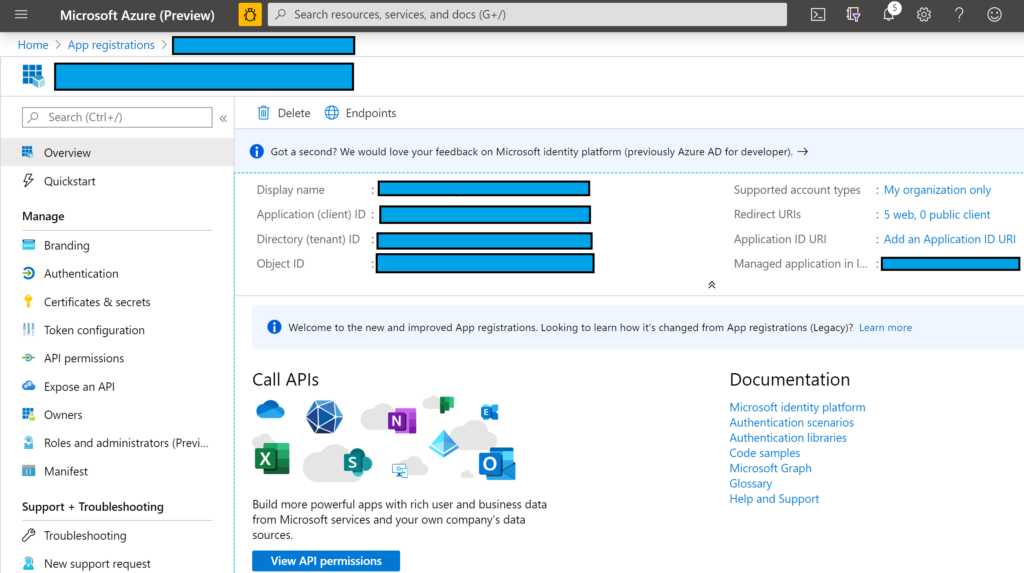
TODO: screenshot of new (preview?) portal, overview section
App Registration screen showing overview

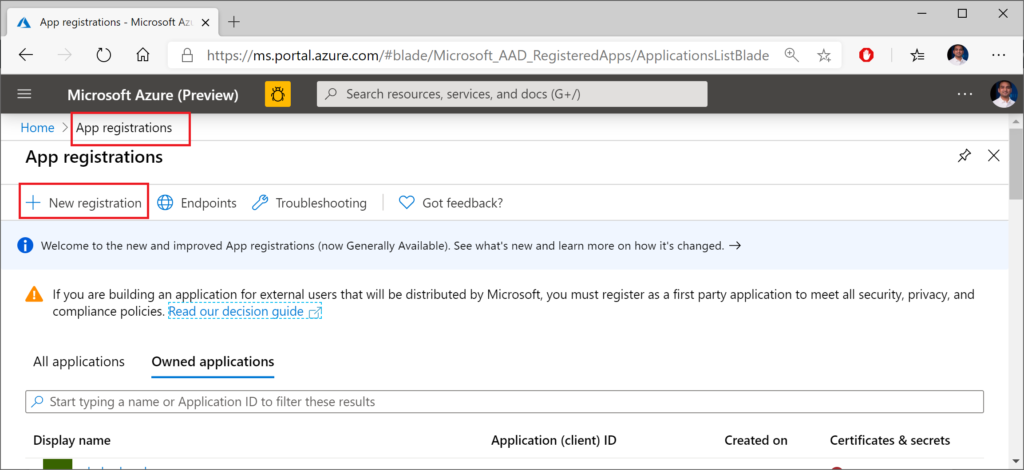
If you’re not clear about how you got to this screen or how to come back to it later, here’s a set of steps that may help.

  1. Log in to the Azure Portal
  2. Search for App Registrations
  3. Arrive at the App Registrations page
  4. When a newer preview version becomes available, you may have to click the banner that takes you to a preview experience.
New App Registration in Azure Portal

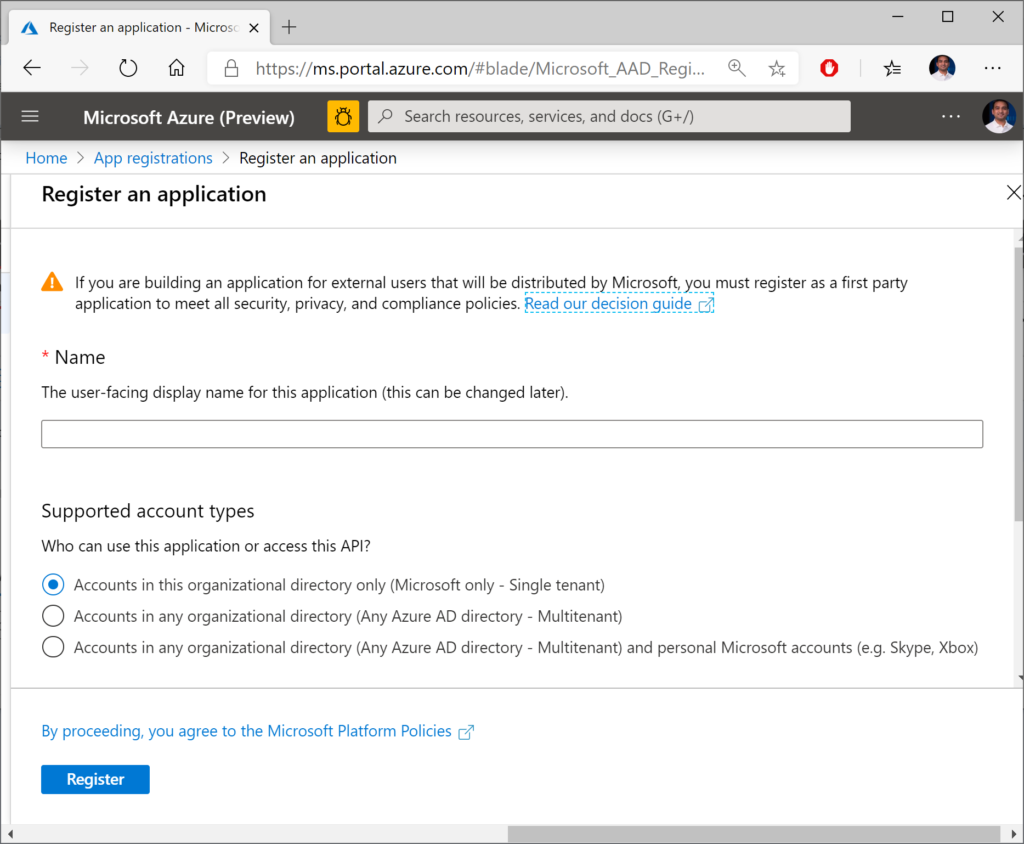
In the form that follows, fill out the values for:

  • Name (which you can change later)
  • Account Type (your org, any org, any org + personal MSA)
  • Redirect URI (where users will return after authentication)
authentication
Register an application for authentication

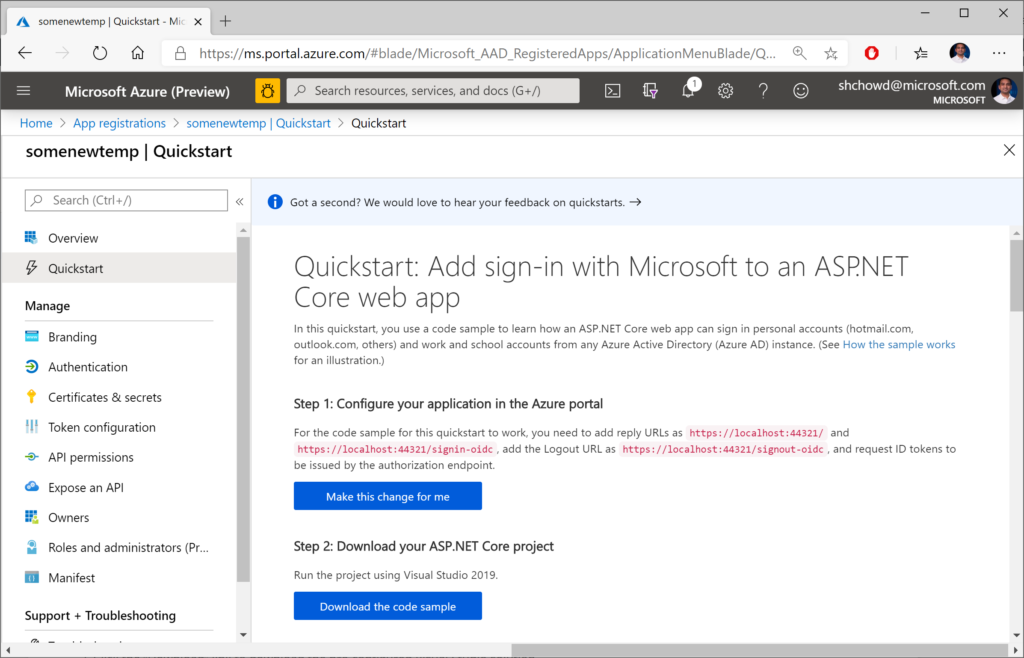
Now you should have options to configure your app and also download a pre-written application to get started. In the QuickStart section for your newly registered application (after selecting  the guide for “ASP .NET Core”, you should see a button to make the changes for you and also download a configured Visual Studio application.

Quickstart screen for app registration

In the steps that follow:

  1. Click the “Make the changes for me” button to make the necessary configuration changes.
  2. Optional: Click the “Download” link to download the pre-configured Visual Studio solution, if you don’t already have a project.

At the time of this writing, the downloadable sample project is a VS2019 application for ASP .NET Core 2.2. You can download it to inspect it, but I would recommend creating a new project manually in VS2019. There may be some subtle differences between projects created by VS2019 with authentication turned on, versus what you get with the downloaded project.

For further customization using the Manifest file available to you, check out the official documentation on the Azure AD app manifest:

Using Authentication in Your Code

When creating a new project in VS2019, you get the following lines of code in your ConfigureServices() method, including calls to .AddAuthentication(). For different project types (MVC, Razor Pages, Blazor), you should also see some additional code setting up the authorization policy.

// contents of ConfigureServices() when created in VS2019

services.AddAuthentication(AzureADDefaults.AuthenticationScheme)
.AddAzureAD(options => Configuration.Bind("AzureAd", options));

The string value “AzureAd” is referenced in your appsettings file, e.g. appsettings.json in MVC, Razor Pages, or Blazor projects. The properties for this entry include the following:

  • Instance: URL for login page, e.g. https://login.microsoftonline.com
  • Domain: your AD tenant’s domain, e.g. microsoft.onmicrosoft.com
  • TenantId: your Tenant Id value, usually a GUID
  • ClientId: Your app’s Client Id, obtained from app registration
  • Callback Path: partial path for sign-in, e.g. /signin-oidc
{
  "AzureAd": {
    "Instance": "https://login.microsoftonline.com/",
    "Domain": "<REPLACE_DOMAIN_NAME>",
    "TenantId": "<REPLACE_TENANT_ID>",
    "ClientId": "<REPLACE_CLIENT_ID>",
    "CallbackPath": "/signin-oidc"
  },
  "Logging": {
    "LogLevel": {
      "Default": "Information",
      "Microsoft": "Warning",
      "Microsoft.Hosting.Lifetime": "Information"
    }
  },
  "AllowedHosts": "*"
}

You can see more information on appsettings.json values in the official docs. You can also open the apssettings.json from the portal-downloaded project to get your own app’s Id values. The following documentation is specifically written for v2, but offers explains for important fields such as ClientId and TenantId.

To get a refresher on Authentication and Authorization in ASP .NET Core 3.1, check out the following post on from earlier in this blog series.

For more on assigning users to specific roles, check out the official documentation at the following URL:

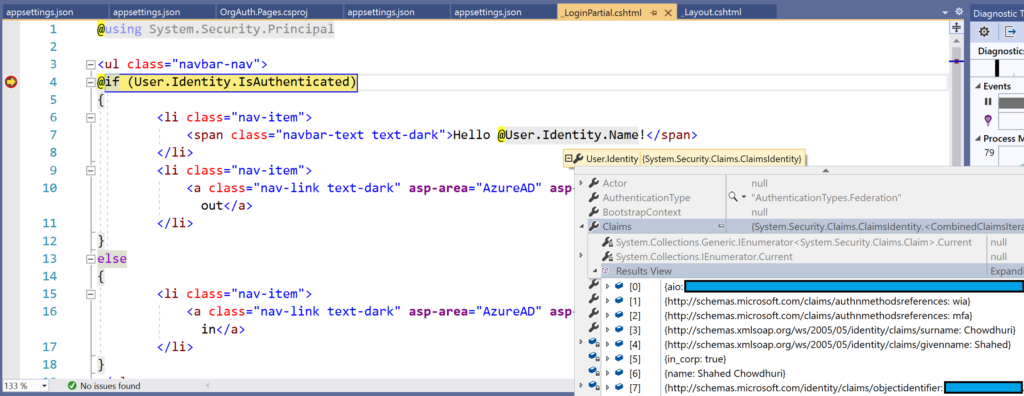
Finally, take a look at the Login.partial.cshtml partial view to observe the way a user’s identity is detected and shown in an MVC or Razor Pages web app. Here is a snippet from the samples:

@if (User.Identity.IsAuthenticated)
{
 <li class="nav-item">
 <span class="nav-text text-dark">Hello @User.Identity.Name!</span>
 </li>
...
}

NOTE: The Blazor web app wraps the authorized content in an <Authorized> tag within an <AuthorizedView. For more on the Blazor project, take a look at the Blazor post:

Depending on what you have access to, the User.Identity object may not contain everything you expect it to. Here are some things to take note of:

  • User.Identity should be null when not logged in
  • User.Identity should be non-null when logged in…
  • … however, User.Identity.Name may be null even when logged in
  • If User.Identity.Name is null, also check User.Identity.Claims
  • User.Identity.Claims should have more than 0 values when logged in

The following screenshot shows an example of the user information in my debugging environment when logged in:

 User.Identity.Name with Claims in debugger
User.Identity.Name with Claims in debugger

Running the Samples

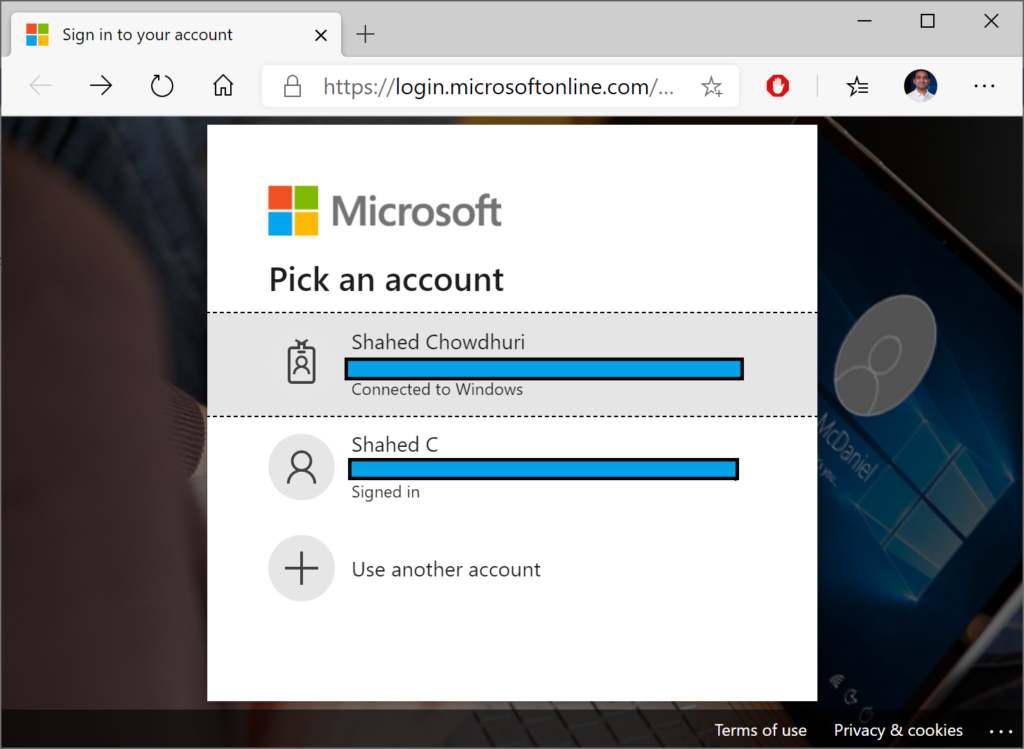
Running the sample web projects should redirect you to the Azure AD login page for your tenant. The login page should look identical for all 3 project types: MVC, Razor Pages or Blazor. If you’ve already logged in to one or more accounts in your browser, you should have one or more identities to select from.

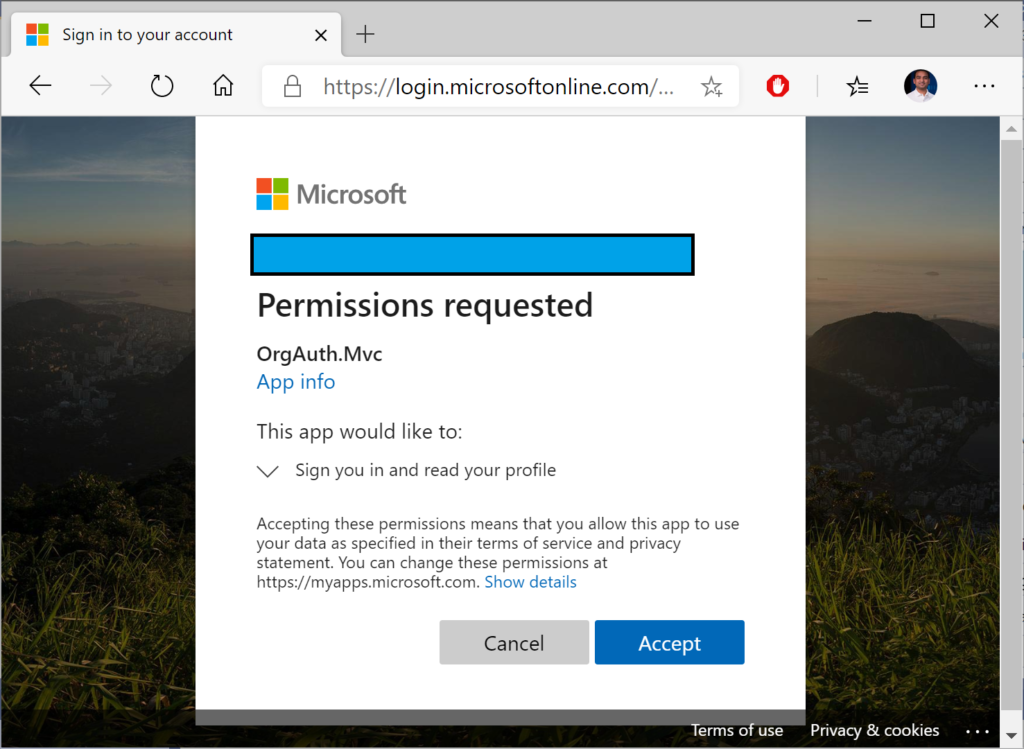
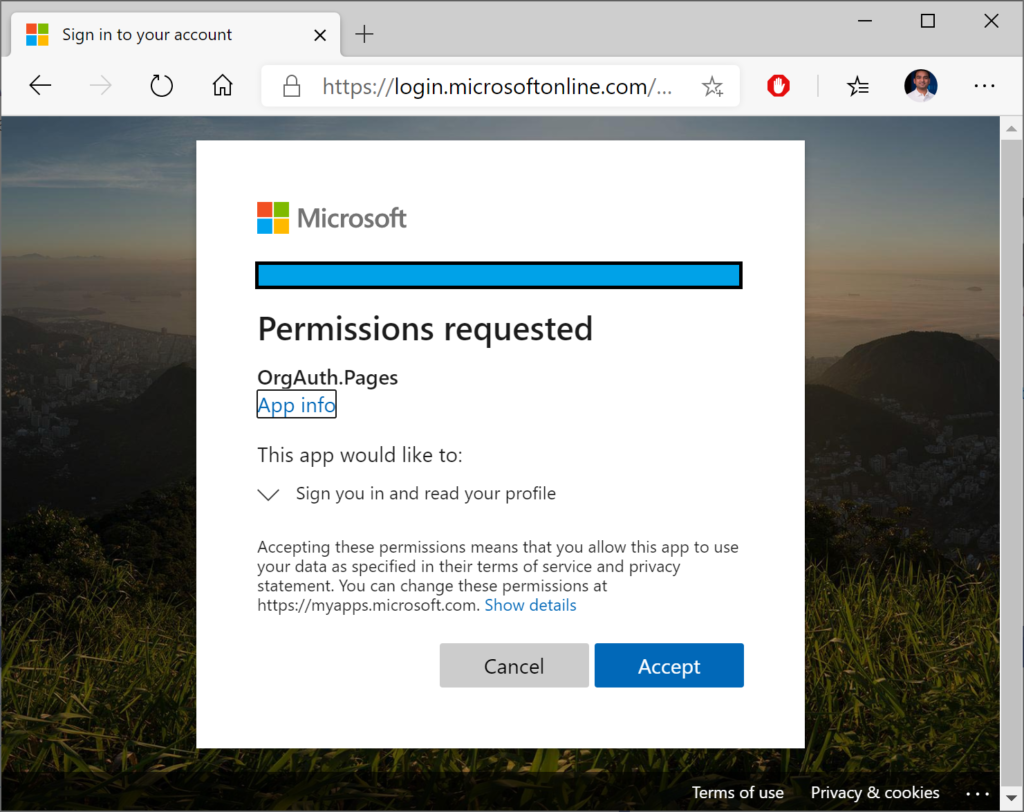
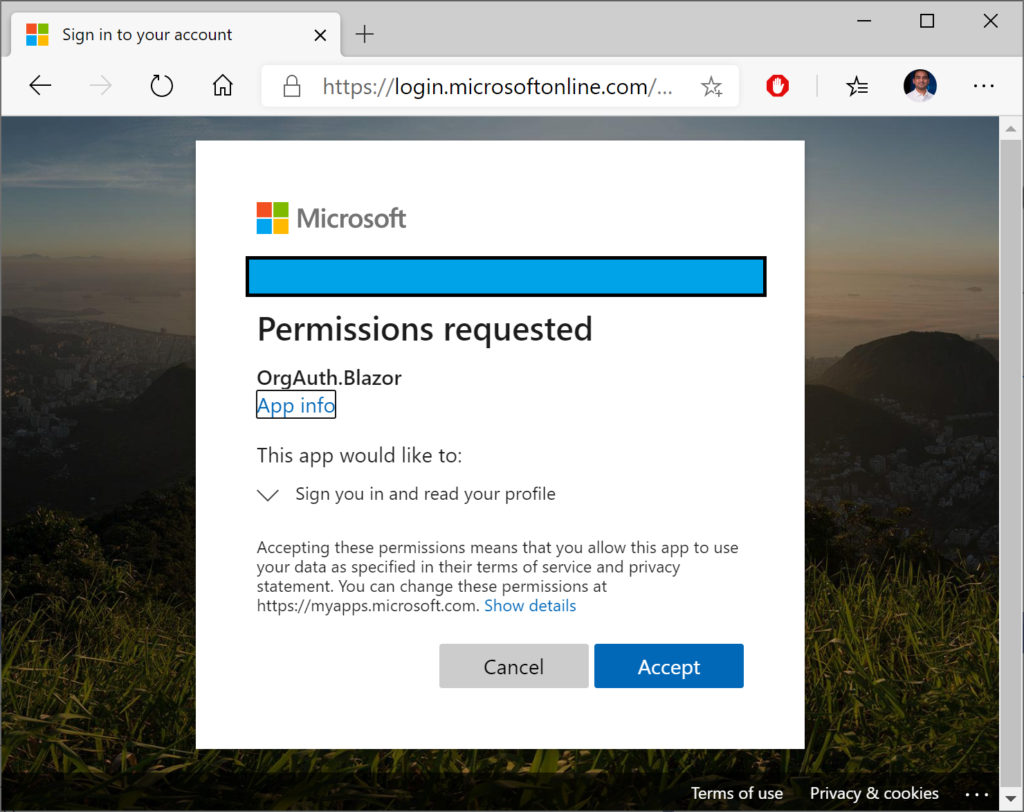
Once you’ve selected an account, you should see a confirmation screen (at least the first time) to Accept the authentication and login. This screen will look similar for all your projects, and the project name should be displayed in the middle.

 MVC app authentication confirmation
MVC app authentication confirmation
Razor Pages app authentication confirmation
Blazor app authentication confirmation

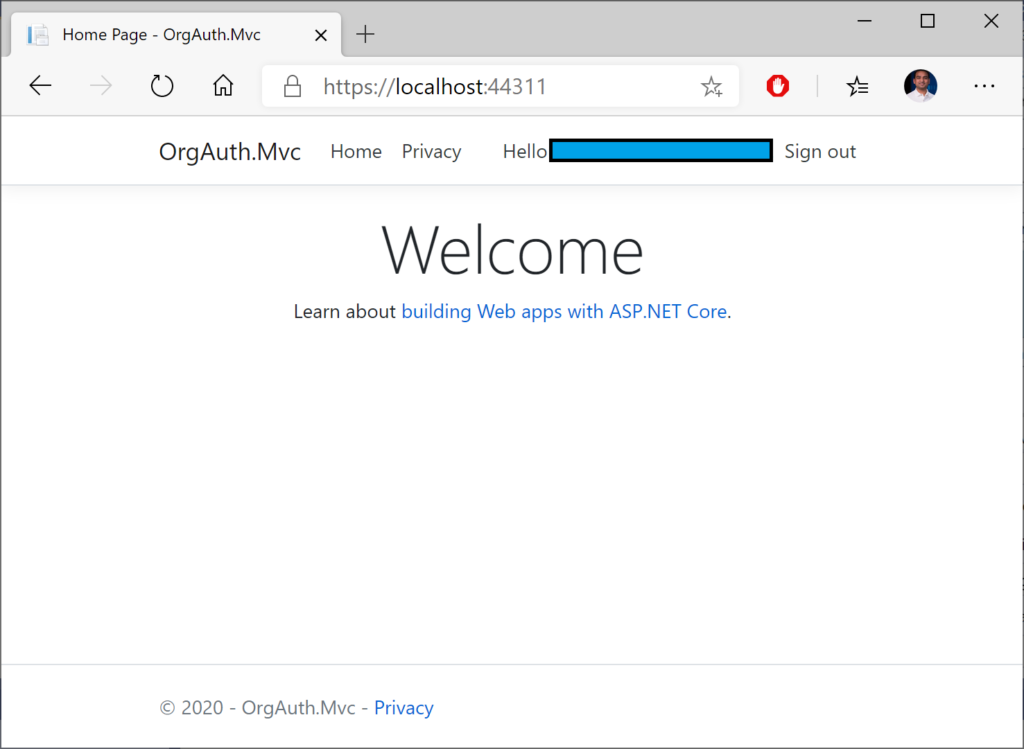
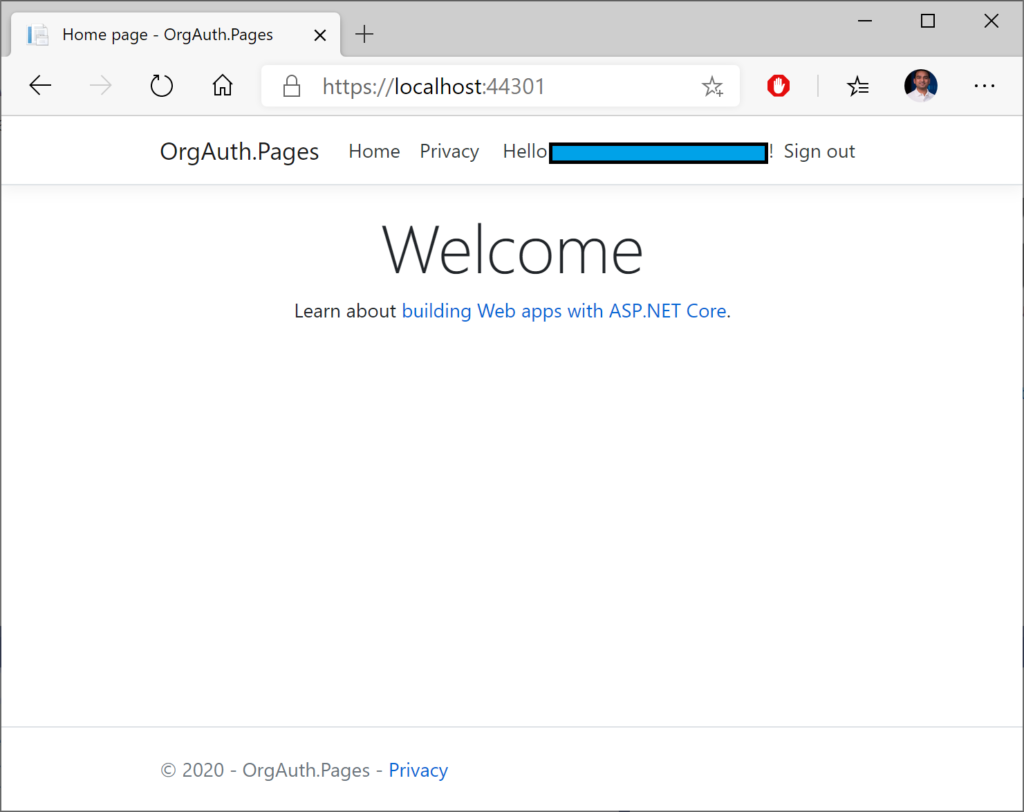
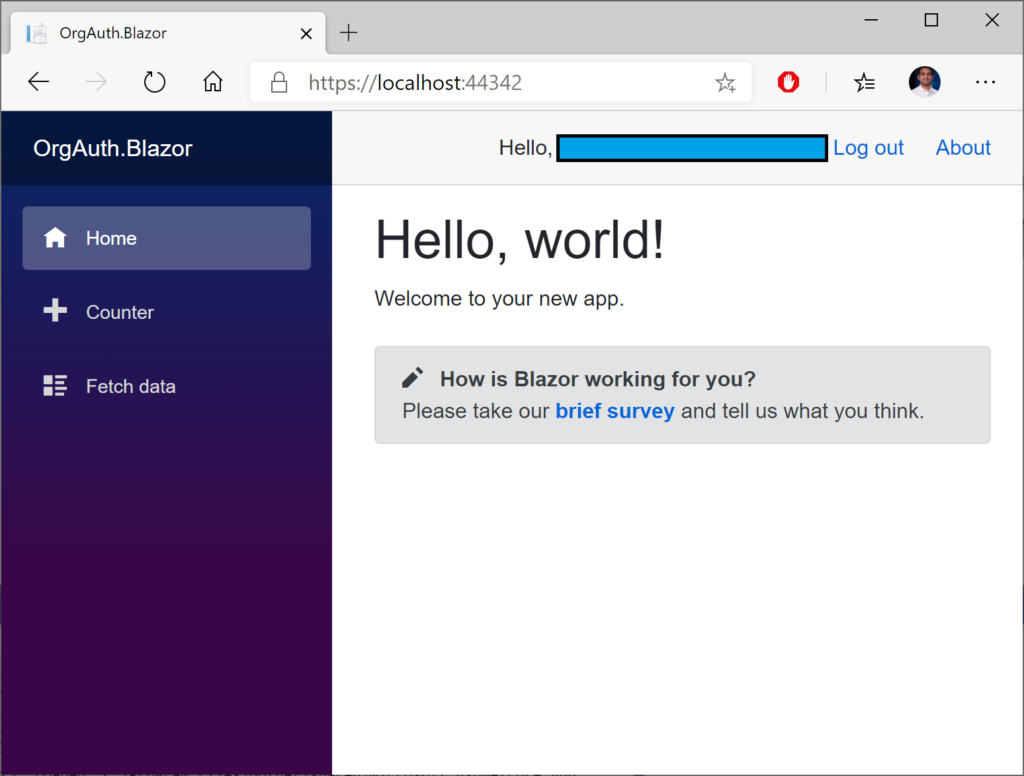
Finally, you should see each web application with some indication that you are currently logged in. In the template-generated sample apps, this is demonstrated by the “Hello” message in the header area.

MVC web app, logged in
Razor Pages web app, logged in
 Blazor web app, logged in
Blazor web app, logged in

References

.NET 5.0, VS2019 Preview and C# 9.0 for ASP .NET Core developers

By Shahed C on April 6, 2020

This is the fourteenth of a new series of posts on ASP .NET Core 3.1 for 2020. In this series, we’ll cover 26 topics over a span of 26 weeks from January through June 2020, titled ASP .NET Core A-Z! To differentiate from the 2019 series, the 2020 series will mostly focus on a growing single codebase (NetLearner!) instead of new unrelated code snippets week.

Previous post:

NetLearner on GitHub:

NOTE: The NetLearner suite of apps won’t be updated to .NET 5.0 at this time, so you can check out the new template-generated projects in an experimental subfolder:

In this Article:

N is for .NET 5.0, VS2019 Preview and C# 9.0

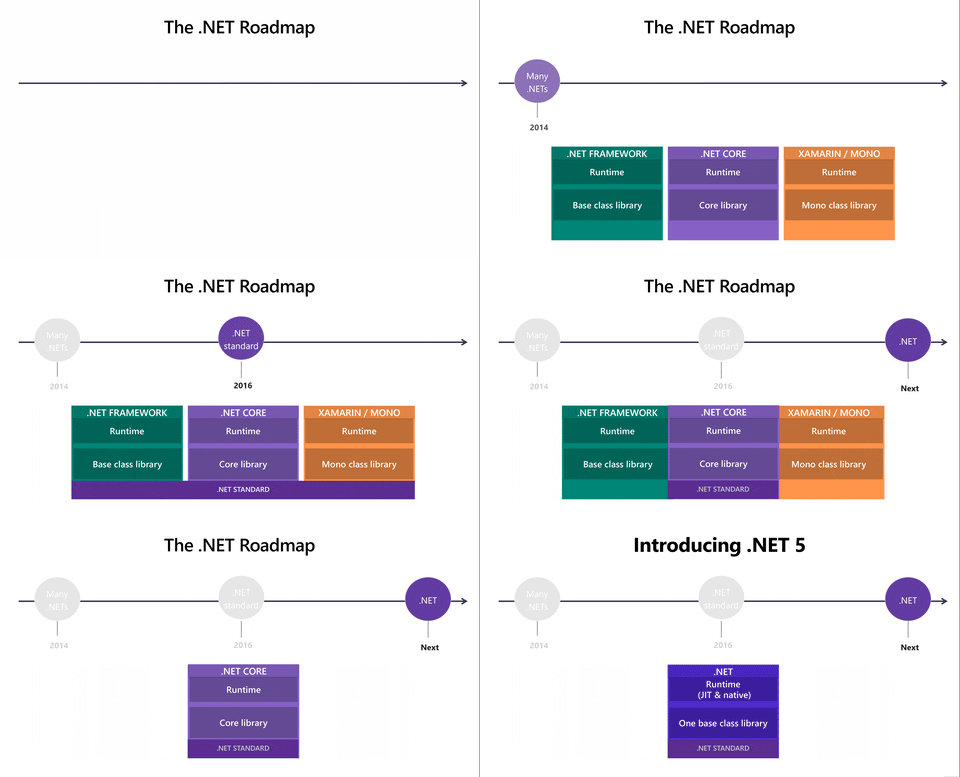
As we have crossed the halfway point in this series, now is a good time to take a step back and look forward at .NET 5.0. This is the next iteration of .NET Core, which skips over the number 4, and unifies all flavors of .NET into a single .NET (i.e. .NET Core, .NET Framework and Mono).

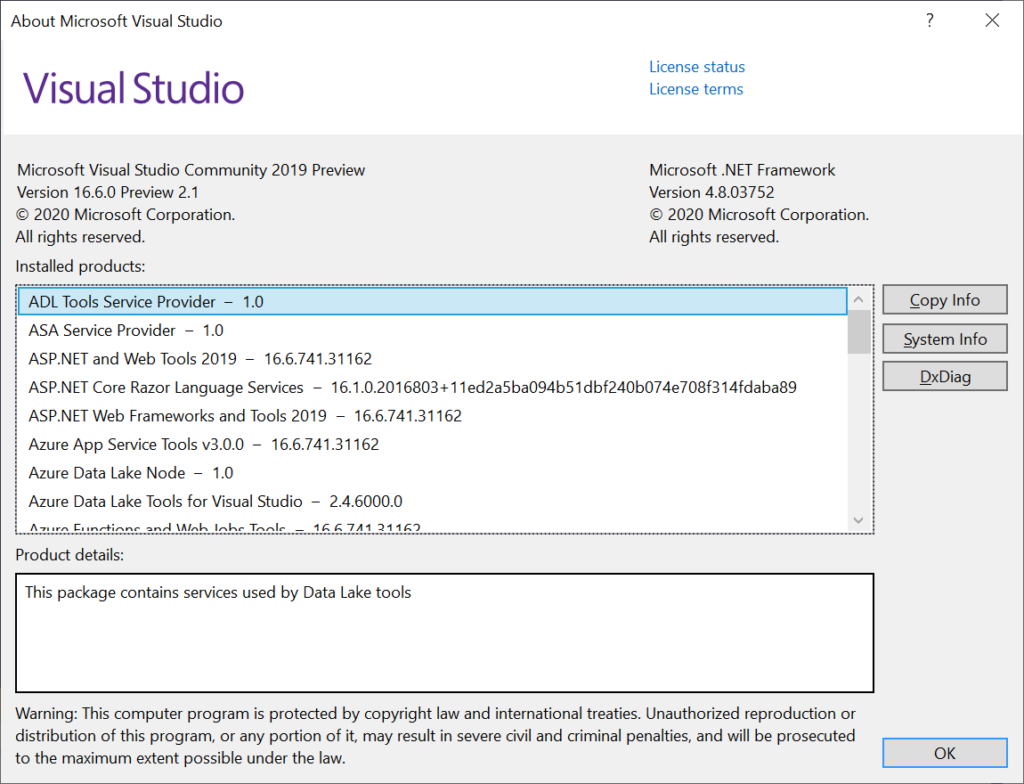
In order to use .NET 5.0 (Preview 2 as of this writing), we need to install Visual Studio 2019 v16.6.0 Preview 2.1. This will give you access to all the latest (preview) project templates for ASP .NET Core 5.0. Since C# 9.0 is still early in development, we will just briefly touch on upcoming/proposed language features.

Visual Studio 2019 Preview

Visual Studio 2019 has been out since early 2019, so you can grab the latest stable version from the main download page. Visit any of the URLs below to select the edition you need:

In order to get the latest Preview version, you must visit the special download page for Previews:

As before, the Community Edition (comparable to Pro) is free for students, open-source contributors and individuals. The Pro and Enterprise editions add additional products and services from small teams to enterprise companies.

But wait! What if you can’t stay online for the length of the installation or need to reinstall quickly at a later date? If you need an offline installer, check out the instructions on the following page:

What are some cool new and improved features to be aware of? There are so many that I stitched together a series of tweets from Amanda Silver (CVP of Product for Developer Tools) and created the following thread in April 2019:

The aforementioned thread highlights the following features. Click each hyperlink in the list below for more info on each.

  • Live Share: Available as an extension in VS Code, Live Share is installed by default with VS2019. Easily collaborate with other developers while coding in real-time!
  • Intellicode: Use AI to write better code. Choose to share what you want with others or keep things private.
  • Git-first workflows: Choose to create a new project from a source code repo or use a template. The new start window provides more options up front.
  • Debug search: Search while debugging. Type in search filters in the Watch, Locals, and Autos panels.
  • Snapshot debugging: Available in the Enterprise Edition, snapshot debugging allows you to get a snapshot of your app’s execution after deployment. This includes cloud deployments, Azure VMs and Kubernetes containers.
  • VS Search: Dynamic search results include commands, menus, components and templates. Note that this was formerly know as Quick Launch.
  • App Service Debugging: Attach the debugger to your app running in Azure App Service!
  • App Service Connectivity: Connect your web app to Azure App Service with ease, including App Insights monitoring.
  • Azure Monitor: Use Azure Monitor to get additional insight on your deployed app!

If you prefer to sit back and relax and just watch a recap of the launch announcements, I put together a handy list of YouTube videos from the VS2019 launch event. This playlist kicks off with the 50-minute keynote, is followed by a string of videos and ends with a cumulative 7-hour video if you prefer to watch all at once.

So, what’s new in the latest version of Visual Studio 2019 v16.6 Preview 2?

  • Version Control: improved Git functionality, including quicker GitHub hosting with a single-click
  • Snapshot Debugging: improved Snapshot Debugger experience, without requiring a restart when using Snapshot Debugger with Azure App Service
  • .NET Async: new .NET Async tool (included with Performance Profiler) to help with better understanding and also optimizing your async/await code
  • JavaScript/TypeScript Debugging: improved JS/TS debugger, with support for debugging service workers, web workers, iframes and in-page JS.
  • .NET Productivity: multiple features for .NET developers including help for the following:
    • add an explicit cast (when an implicit cast isn’t possible),
    • add a “file banner” across one or more code files,
    • refactor/simply conditional expressions,
    • convert regular string literals to verbatim strings

The list of features above is just a summary of the official announcement. For details on each of these features, check out the official announcement at:

.NET 5.0 Preview 2

To get started, start with the latest version of .NET 5.0:

If you’ve already installed Visual Studio 2019, you may have followed the following steps:

  1. Download Visual Studio 2019 Preview
  2. Click File | New | Project (or create new from splash screen)
  3. Create a new ASP .NET Core Web App
  4. Select .NET Core and then ASP .NET Core 5.0 as the project type/platform

NOTE: For previous versions of .NET Core, you may not have seen an option for ASP .NET Core 3.0 in the list of project templates after installing VS2019. When ASP .NET Core 3.0 was still in preview as of April 2019 (even after the release of Visual Studio 2019), it was not automatically available for selection. In order to create ASP .NET Core 3.0 projects with VS2019, you would have had to install .NET Core 3.0 and enable previews of the .NET Core SDK in Visual Studio’s Options panel.

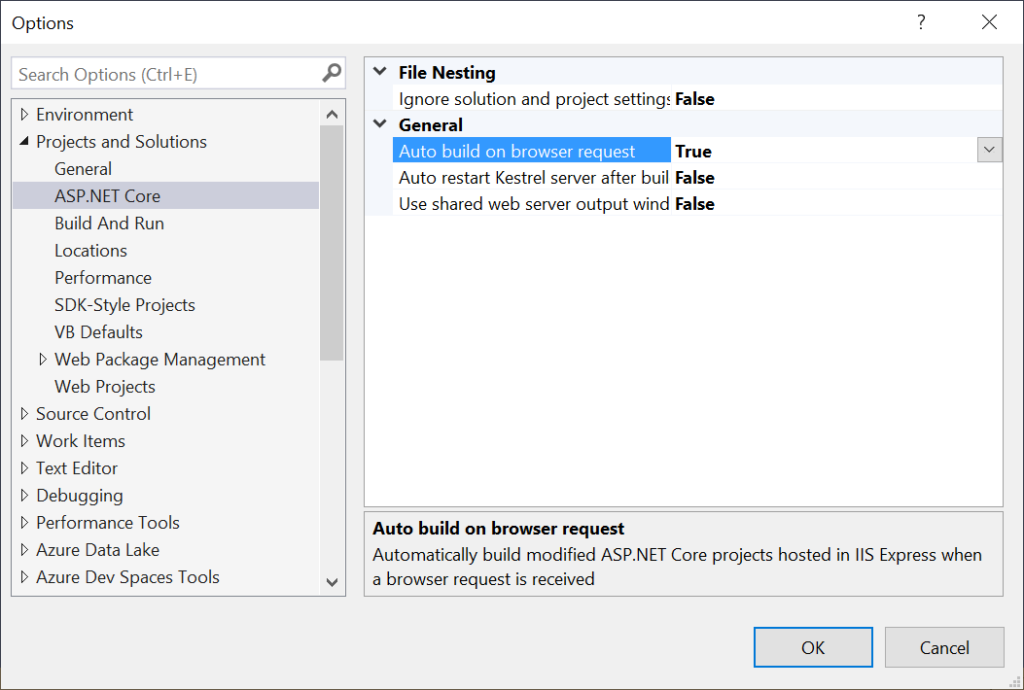
In Visual Studio 2019 Preview, this additional step isn’t necessary for ASP .NET Core 5.0. In fact, the Options panel includes settings for ASP .NET Core, without any mention of enabling preview versions.

VS2019 Options panel

C# 9.0 Features

To see what’s to come in C# 9.0, check out the official list of milestones on GitHub, specifically Milestone 15 for C# 9.0:

There are already dozens of feature candidates for the C# 9.0 release. The list includes Records and Pattern-Based “With” Expressions. From the official proposal, “Records are a new, simplified declaration form for C# class and struct types that combine the benefits of a number of simpler features“.

This new feature allows you to omit an argument for its corresponding optional parameter, when invoking a function member. In this case, the value of the receiver’s member is implicitly passed. This is accomplished in by the use of a “with-expression” and the use of this.SomeIdentifier to set a default argument.

Here is an example of what that could look like:

class TwitterUser
{
    public readonly int Followers;
    public readonly int Following;
    public TwitterUser With(
        int followers = this.Followers, 
        int following = this.Following) 
            => new TwitterUser(followers, following);

}

How would you use this so-called “caller-receiver default argument?

TwitterUser twitterUser1 = new TwitterUser(1000, 2000)
TwitterUser twitterUser2 = twitterUser1.With(followers: 0);

The above code creates a new TwitterUser, using the existing object to copy its values but changes the number of followers. For more information about the Records feature, check out the official proposal with detailed notes and code samples:

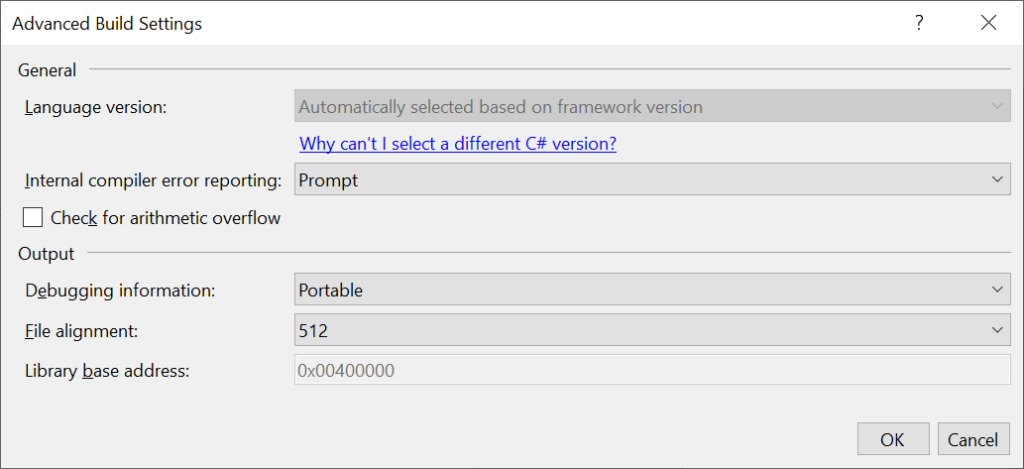
NOTE: To ensure that C# 9.0 preview features are available when a preview version becomes available, you can set the LangVersion property explicitly for your project. This setting is buried deep inside your Advanced settings within your project’s Build tab.

To update the language setting (after a future preview release):

  1. Right-click your project in Solution Explorer.
  2. Select Properties to view your project properties.
  3. Click the Build tab within your project properties.
  4. Click the Advanced button on the lower right.
  5. Select the appropriate Language version, e.g. C# 9.0 (beta)
  6. Optional: you may select “unsupported preview…” instead

If you try the above steps with VS2019 v16.6.0 Preview 2 (as of this writing), the language version selection is not available at this time. For more information on C# language versioning, check out the official documentation at:

C# Language Version Selection

The above screenshot shows the aforementioned setting in the Visual Studio UI. If you wish to update your .csproj file directly, you may view/edit the <LangVersion> value. A few samples are shown below:

For a .NET Core 3.0 console app set to use C# preview versions, the value of <LangVersion> is set to the value “preview”. This may be subject to change for C# 9 when it is released.

<Project Sdk="Microsoft.NET.Sdk">
   <PropertyGroup>
      <OutputType>Exe</OutputType>
      <TargetFramework>netcoreapp3.0</TargetFramework>
      <LangVersion>preview</LangVersion>
   </PropertyGroup>
</Project>

For a .NET Core 3.0 console app set to use C# 8.0 explicitly before its release, the value of <LangVersion> was set to the value “8.0”. Once again, this may be subject to change for C# 9.

<Project Sdk="Microsoft.NET.Sdk">
   <PropertyGroup>
      <OutputType>Exe</OutputType>
      <TargetFramework>netcoreapp3.0</TargetFramework>
      <LangVersion>8.0</LangVersion>
   </PropertyGroup>
</Project> 

ASP .NET Core 5.0 Project Types

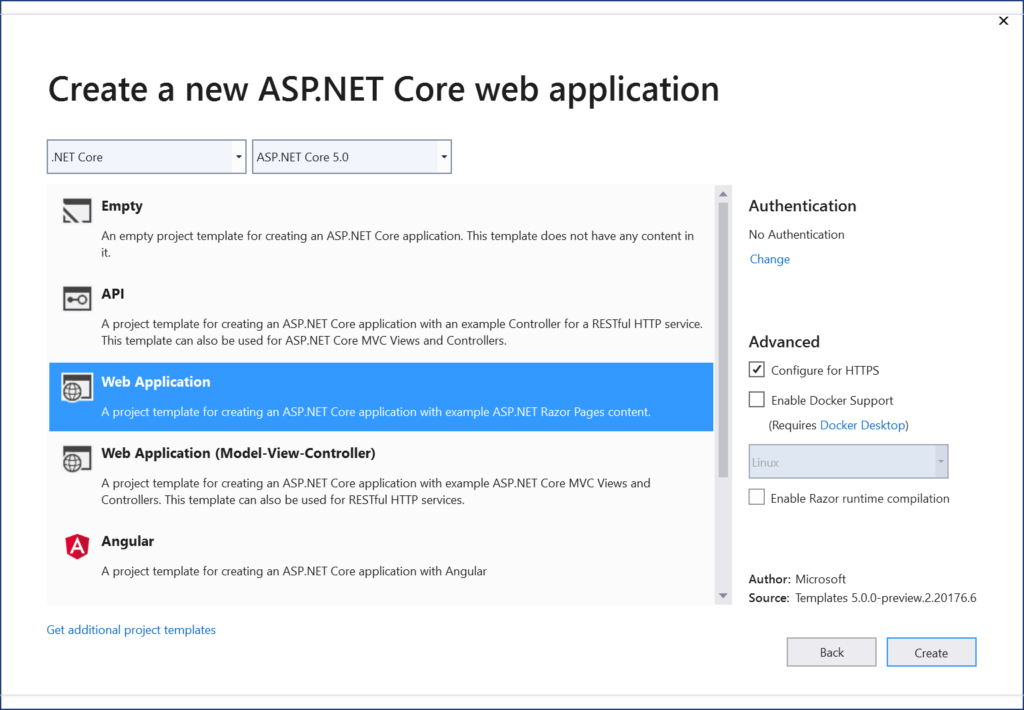
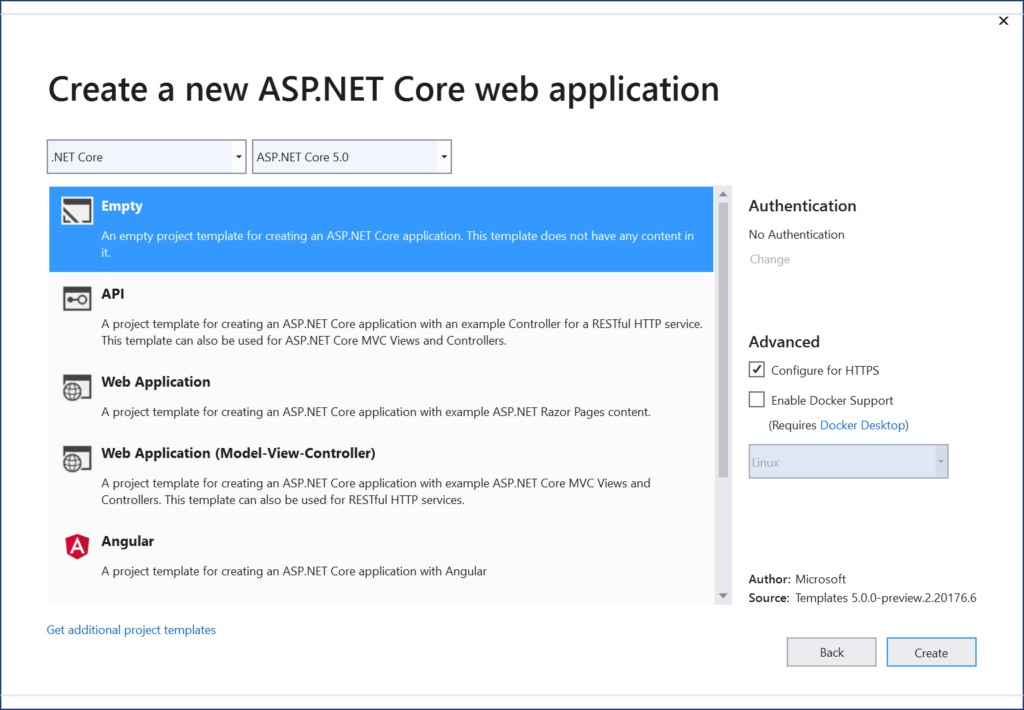
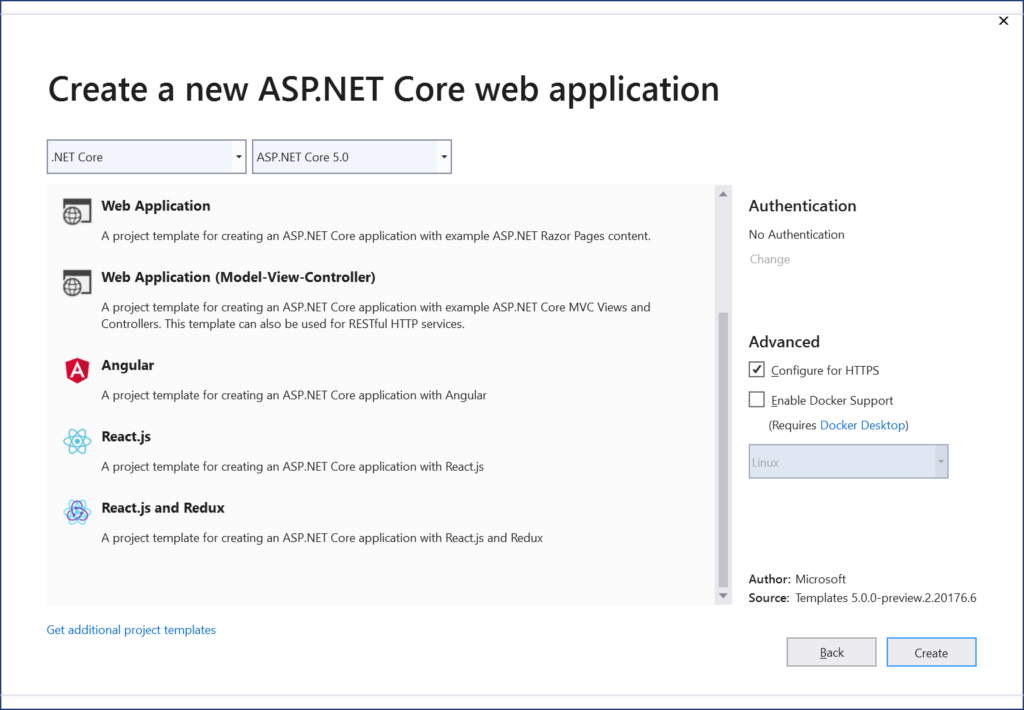
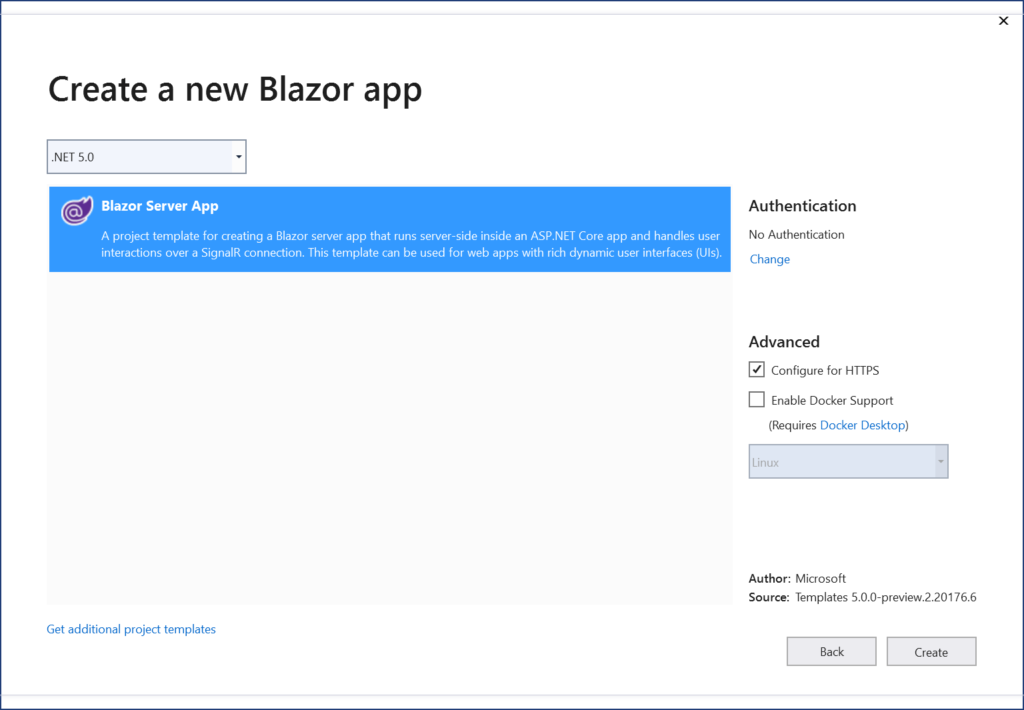
When you create a new .NET 5.0 web project with Visual Studio 2019, you’ll see some familiar project types. You will also see some new project types. These are shown in the 2 screenshots below:

List of ASP .NET Core 5.0 projects
 List of ASP .NET Core 5.0 projects (continued)
List of ASP .NET Core 5.0 projects (continued)

The above project types are described below:

  1. Empty: familiar empty project that just writes out Hello World to the HTTP Response, without the use of MVC or Razor Pages
  2. API: familiar project type for creating Web APIs and RESTful services. Can be mixed and matched with Razor Pages or MVC components.
  3. Web Application: familiar project type for creating Web Apps with Razor Pages. Can be mixed and matched with Web API and/or MVC components.
  4. Web Application (MVC): familiar project type for creating Web Apps with MVC application structure. Can be mixed and matched with Razor Pages and/or Web API.
  5. Angular, React.js, React.js and Redux: familiar web projects for web developers who wish to build a JavaScript front-end, typically with a Web API backend.

FYI, the following project templates have moved out of their original location (inside ASP .NET Core web apps):

  • gRPC Service: allows creation of a new gRPC service to make use of Google’s high-performance Remote Procedure Call (RPC) framework
  • Worker Service: allows creation of background processes, e.g. Windows services or Linux daemons.
  • Razor Class Library: allows creation of reusable UI Class Libraries with Razor Pages. See previous post on Razor Class Libraries.

Blazor’s server-side project template can also be found at the root-level of the template list, under Blazor App.

List of ASP .NET Core 5.0 projects (Blazor Server)

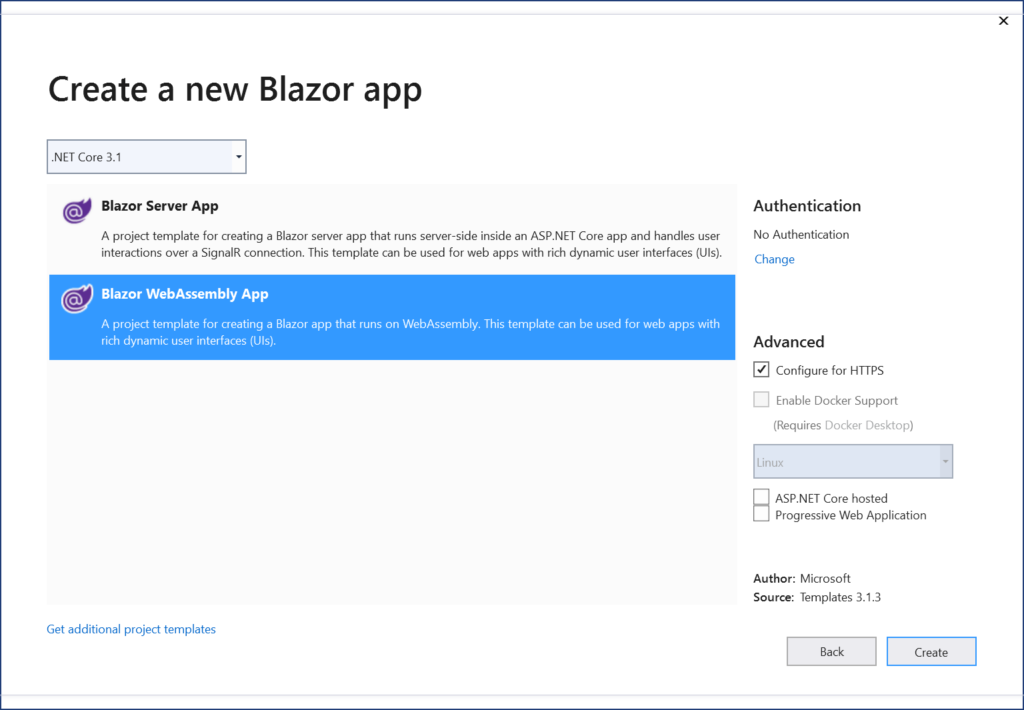
Well, what about client-side Blazor? You may have noticed that server-side Blazor (aka Razor Components are mentioned, but there is no sign of client-side Blazor. As of March 2020, client-side Blazor running in the browser with WebAssembly is still in preview (v3.2.0 Preview 3).

If you were to install the latest .NET Core 3.1 SDK, you would also have to download the latest Blazor WebAssembly separately.

In order to install the client-side template from a command line, run the following command:

dotnet new -i Microsoft.AspNetCore.Components.WebAssembly.Templates::3.2.0-preview2.20160.5

NOTE: Installing VS2019 v16.6 Preview 2 automatically installs an updated version of the .NET Core 3.1 SDK. This version includes the latest Blazor WebAssembly template. This means that a manual installation of client-side Blazor is not required when using this preview version of Visual Studio. However, you would have to select .NET Core 3.1 after selecting Blazor, if you wish to select the latest client-side Blazor WebAssembly template in VS2019 v16.6 Preview 2.

Blazor templates in VS2019 Preview

On a related note, check out my previous post on server-side Blazor:

Migrating from 3.1 to 5.0

With all this goodness on the roadmap, you may be wondering how you can start migrating your ASP .NET Core 3.1 projects to .NET 5.0. Fear not, the official guide (a work in progress) is now available:

This documented migration process involves the following steps:

  1. Update .NET Core SDK version in global.json (from “3.1.200” to “5.0.100-preview.2.20176.6”)
  2. Update the target framework (from netcoreapp3.1 to netcoreapp5.0)
  3. Update package references (e.g. from “3.1.2” to “5.0.0-preview.2.20167.3”)
  4. Update Docker images to include a base image that includes ASP .NET Core 5.0 (e.g. by using the docker pull command followed by mcr.microsoft.com/dotnet/core/aspnet:5.0)
  5. Review breaking changes: refer to https://docs.microsoft.com/en-us/dotnet/core/compatibility/3.1-5.0

To deploy a .NET 5 project via Azure DevOps, try the following YAML

steps:
- task: UseDotNet@2
  inputs:
    packageType: sdk
    version: 5.0.100-preview.2.20176.6
    installationPath: $(Agent.ToolsDirectory)/dotnet 

The above YAML snippet is a suggestion from .NET developer Neville Nazerane via the unofficial ASP .NET Core Facebook group:

NOTE: ASP .NET Core in .NET 5.0 Preview 2 only includes minor bug fixes (but not any major new features).

References

Logging in ASP .NET Core 3.1

By Shahed C on March 24, 2020

This is the twelfth of a new series of posts on ASP .NET Core 3.1 for 2020. In this series, we’ll cover 26 topics over a span of 26 weeks from January through June 2020, titled ASP .NET Core A-Z! To differentiate from the 2019 series, the 2020 series will mostly focus on a growing single codebase (NetLearner!) instead of new unrelated code snippets week.

Previous post:

NetLearner on GitHub:

In this Article:

L is for Logging in ASP .NET Core

You could write a fully functional ASP .NET Core web application without any logging. But in the real world, you should use some form of logging. This blog post provides an overview of how you can use the built-in logging functionality in ASP .NET Core web apps. While we won’t go deep into 3rd-party logging solutions such as Serilog in this article, you should definitely consider a robust semantic/structured logging solution for your projects.

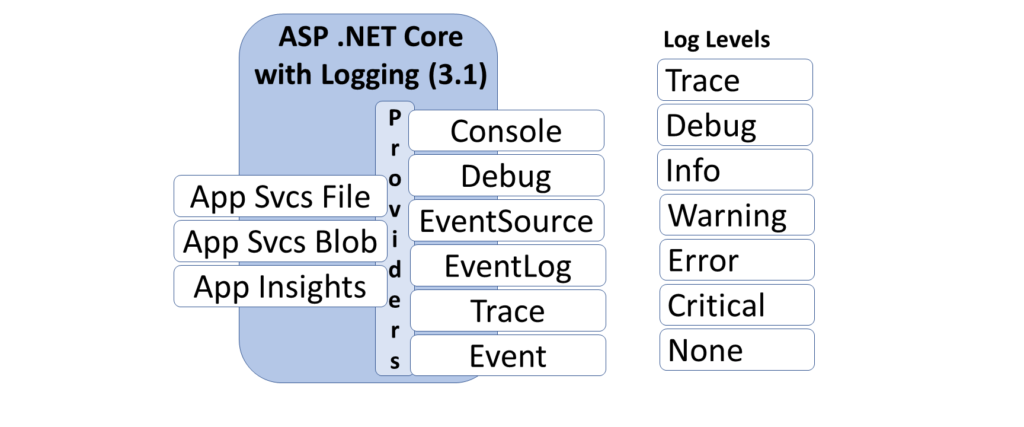
Logging providers in ASP .NET Core 3.1

Log Messages

The simplest log message includes a call to the extension method ILogger.Log()  by passing on a LogLevel and a text string. Instead of passing in a LogLevel, you could also call a specific Log method such as LogInformation() for a specific LogLevel. Both examples are shown below:

// Log() method with LogLevel passed in 
_logger.Log(LogLevel.Information, "some text");

// Specific LogXX() method, e.g. LogInformation()
_logger.LogInformation("some text");

LogLevel values include Trace, Debug, Information, Warning, Error, Critical and None. These are all available from the namespace Microsoft.Extensions.Logging. For a more structured logging experience, you should also pass in meaningful variables/objects following the templated message string, as all the Log methods take in a set of parameters defined as “params object[] args”.

public static void Log (
   this ILogger logger, LogLevel logLevel, string message, params object[] args);

This allows you to pass those values to specific logging providers, along with the message itself. It’s up to each logging provider on how those values are captured/stored, which you can also configure further. You can then query your log store for specific entries by searching for those arguments. In your code, this could look something like this:

_logger.LogInformation("some text for id: {someUsefulId}", someUsefulId);

Even better, you can add your own EventId for each log entry. You can facilitate this by defining your own set of integers, and then passing an int value to represent an EventId. The EventId type is a struct that includes an implicit operator, so it essentially calls its own constructor with whatever int value you provide.

_logger.LogInformation(someEventId, "some text for id: {someUsefulId}", someUsefulId);

In the NetLearner.Portal project, we can see the use of a specific integer value for each EventId, as shown below:

// Step X: kick off something here
_logger.LogInformation(LoggingEvents.Step1KickedOff, "Step {stepId} Kicked Off.", stepId);

// Step X: continue processing here
_logger.LogInformation(LoggingEvents.Step1InProcess, "Step {stepId} in process...", stepId);

// Step X: wrap it up
_logger.LogInformation(LoggingEvents.Step1Completed, "Step {stepId} completed!", stepId);

The integer values can be whatever you want them to be. An example is shown below:

public class LoggingEvents
{
   public const int ProcessStarted = 1000; 

   public const int Step1KickedOff = 1001;
   public const int Step1InProcess = 1002;
   public const int Step1Completed = 1003; 
   ...
}

Logging Providers

The default template-generated web apps include a call to CreateDefaultBuilder() in Program.cs, which automatically adds the Console and Debug providers. As of ASP.NET Core 2.2, the EventSource provider is also automatically added by the default builder. When on Windows, the EventLog provider is also included.

 public static IHostBuilder CreateHostBuilder(string[] args) =>
    Host.CreateDefaultBuilder(args)
      .ConfigureWebHostDefaults(webBuilder =>
      {
         webBuilder.UseStartup<Startup>();
      });

NOTE: As mentioned in an earlier post in this blog series, the now-deprecated Web Host Builder has been replaced by the Generic Host Builder with the release of .NET Core 3.0.

If you wish to add your own set of logging providers, you can expand the call to CreateDefaultBuilder(), clear the default providers, and then add your own. The built-in providers now include ConsoleDebug, EventLog, TraceSource and EventSource.

public static IHostBuilder CreateHostBuilder(
   string[] args) => Host.CreateDefaultBuilder(args)  
      .ConfigureWebHostDefaults(webBuilder =>
      {
         webBuilder.UseStartup<Startup>();
      })
      .ConfigureLogging(logging =>  
      {  
         // clear default logging providers
         logging.ClearProviders();  

         // add built-in providers manually, as needed 
         logging.AddConsole();   
         logging.AddDebug();  
         logging.AddEventLog();
         logging.AddEventSourceLogger();
         logging.AddTraceSource(sourceSwitchName); 
      });

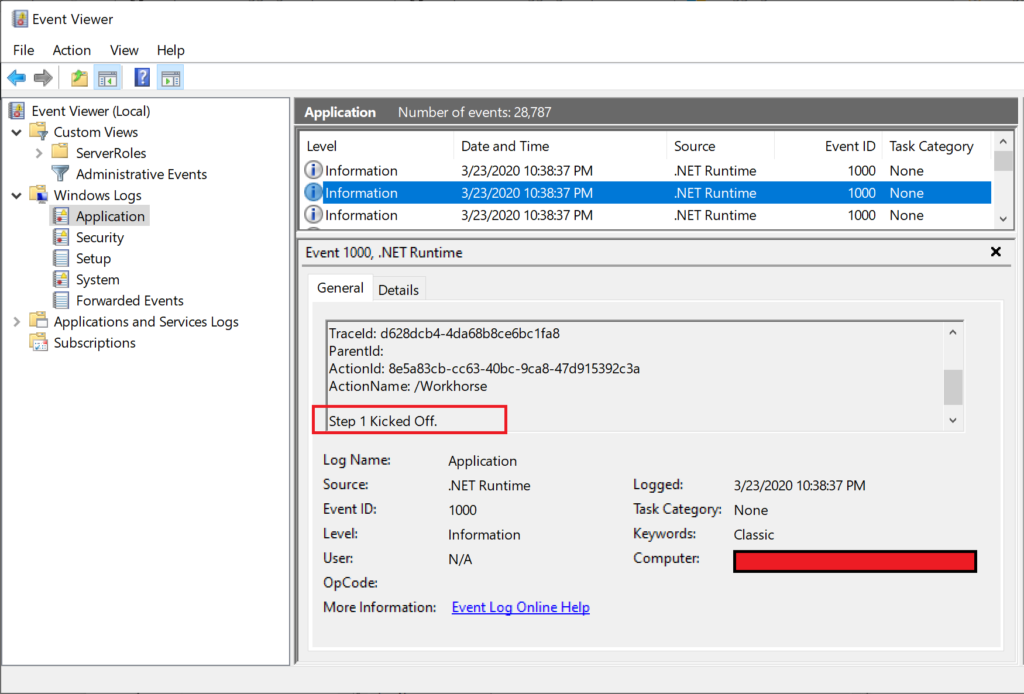
The screenshots below show the log results viewable in Visual Studio’s Debug Window and in the Windows 10 Event Viewer. Note that the EventId’s integer values (that we had defined) are stored in the EventId field as numeric value in the Windows Event Viewer log entries.

 VS2019 Output panel showing debug messages
VS2019 Output panel showing debug messages
Windows Event Viewer showing log data

For the Event Log provider, you’ll also have to add the following NuGet package and corresponding using statement:

Microsoft.Extensions.Logging.EventLog

For the Trace Source provider, a “source switch” can be used to determine if a trace should be propagated or ignored. For more information on the Trace Source provider and the Source Switch it uses check out the official docs at:

For more information on adding logging providers and further customization, check out the official docs at:

JSON Configuration

One way to configure each Logging Provider is to use your appsettings.json file. Depending on your environment, you could start with appsettings.Development.json or App Secrets in development, and then use environment variables, Azure Key Vault in other environments. You may refer to earlier blog posts from 2018 and 2019 for more information on the following:

In your local JSON config file, your configuration uses the following syntax:

{
   "Logging": {
      "LogLevel": {
         "Default": "Debug",
         "Category1": "Information",
         "Category2": "Warning"
      },
      "SpecificProvider":
      {
         "ProviderProperty": true
      }
   }
}

The configuration for LogLevel sets one or more categories, including the Default category when no category is specified. Additional categories (e.g. System, Microsoft or any custom category) may be set to one of the aforementioned LogLevel values.

The LogLevel block can be followed by one or more provider-specific blocks (e.g. Console) to set its properties, e.g. IncludeScopes. Such an example is shown below.

{
   "Logging": {
      "LogLevel": {
         "Default": "Debug",
         "System": "Information",
         "Microsoft": "Information"
      },
      "Console":
      {
         "IncludeScopes": true
      }
   }
}

To set logging filters in code, you can use the AddFilter () method for specific providers or all providers in your Program.cs file. The following syntax can be used to add filters for your logs.

  .ConfigureLogging(logging =>
      logging.AddFilter("Category1", LogLevel.Level1)
         .AddFilter<SomeProvider>("Category2", LogLevel.Level2));

In the above sample, the following placeholders can be replaced with:

  • CategoryX: System, Microsoft, custom categories
  • LogLevel.LevelX: Trace, Debug, Information, Warning, Error, Critical, None
  • SomeProvider: Debug, Console, other providers

To set the EventLog level explicitly, add a section for “EventLog” with the default minimum “LogLevel” of your choice. This is useful for Windows Event Logs, because the Windows Event Logs are logged for Warning level or higher, by default.

{
   "Logging": {
     "LogLevel": {
       "Default": "Debug"
     },
     "EventLog": {
       "LogLevel": {
         "Default": "Information"
       }
     }
   }
 }

Log Categories

To set a category when logging an entry, you may set the string value when creating a logger. If you don’t set a value explicitly, the fully-qualified namespace + class name is used. In the WorkhorseModel class seen in The NetLearner.Portal project, the log results seen in the Debug window started with:

NetLearner.Portal.Pages.WorkhorseModel

This is the category name created using the class name passed to the constructor in WorkhorseModel as shown below:

private readonly ILogger _logger; 

public WorkhorseModel(ILogger<WorkhorseModel> logger)
{
   _logger = logger;
}

If you wanted to set this value yourself, you could change the code to the following:

private readonly ILogger _logger; 

public WorkhorseModel(WorkhorseModel logger)
{
   _logger = logger.CreateLogger("NetLearner.Portal.Pages.WorkhorseModel");
}

The end results will be the same. However, you may notice that there are a couple of differences here:

  1. Instead of ILogger<classname> we are now passing in an ILoggerFactory type as the logger.
  2. Instead of just assigning the injected logger to the private _logger variable, we are now calling the factory method CreateLogger() with the desired string value to set the category name.

Exceptions in Logs

In addition to EventId values and Category Names, you may also capture Exception information in your application logs. The various Log extensions provide an easy way to pass an exception by passing the Exception object itself.

try 
{
   // try something here
   throw new Exception();
} catch (Exception someException)
{
   _logger.LogError(eventId, someException, "Trying step {stepId}", stepId);
   // continue handling exception
}

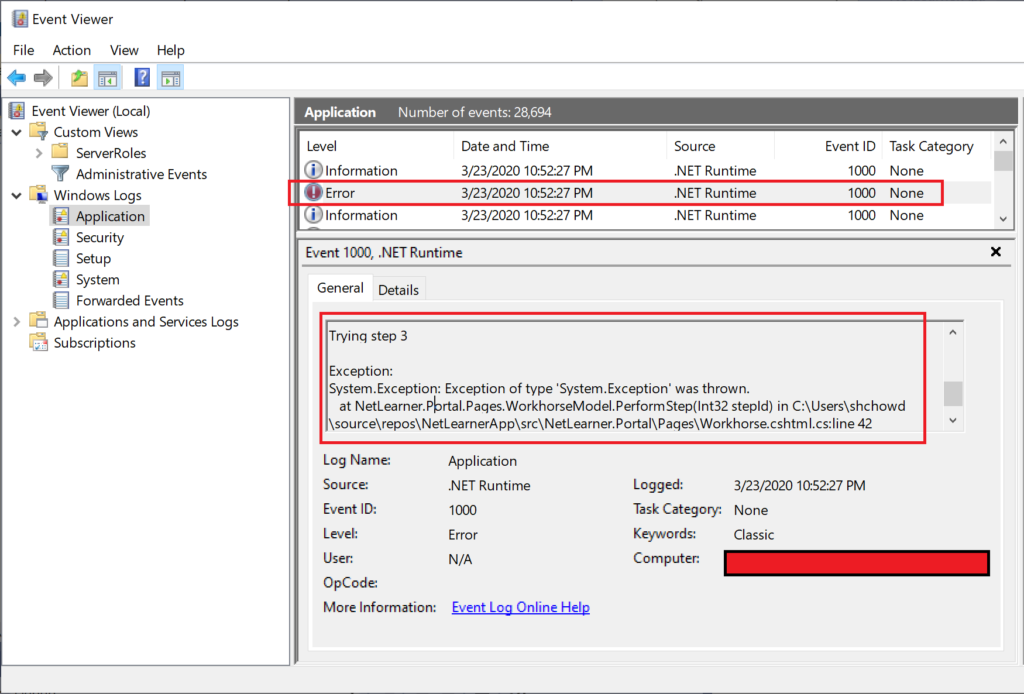
Checking the Event Viewer, we may see a message as shown below. The LogLevel is shown as “Error” because we used the LogError() extension method in the above code, which is forcing an Exception to be thrown. The details of the Exception is displayed in the log as well.

Windows Event Viewer showing error log entry

Structured Logging with Serilog

At the very beginning, I mentioned the possibilities of structured logging with 3rd-party providers. There are many solutions that work with ASP .NET Core, including (but not limited to) elmahNLog and Serilog. Here, we will take a brief look at Serilog.

Similar to the built-in logging provider described throughout this article, you should include variables to assign template properties in all log messages, e.g.

Log.Information("This is a message for {someVariable}", someVariable);

To make use of Serilog, you’ll have to perform the following steps:

  1. grab the appropriate NuGet packages: SerilogHosting, various Sinks, e,g, Console
  2. use the Serilog namespace, e.g. using Serilog
  3. create a new LoggerConfiguration() in your Main() method
  4. call UseSerilog() when creating your Host Builder
  5. write log entries using methods from the Log static class.

For more information on Serilog, check out the following resources:

References